|
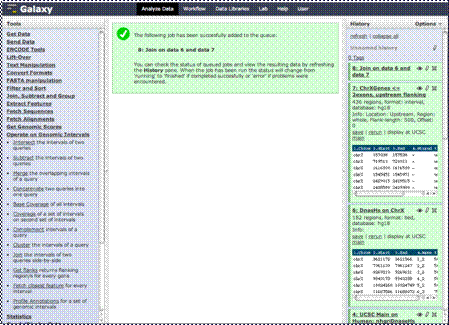
Let’s open the
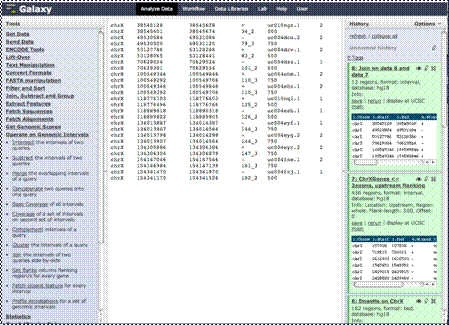
history summary and view the data by clicking the “eye” icon. As you see in
the history summary when we opened it, our new dataset has 13 upstream
regions of genes in the X chromosome. These are flanking regions that have
overlap with Dnase hypersensitive sites. Here you’ll see the columns of data
from the locations that had overlap. The first columns are those of the first
dataset with chromosomal locations, strand, name and more. If you scroll over
to the right, you’ll see the data columns from the second dataset, the
hypersensitive sites, including location, name and score.
|