|
The Next Generation
Sequencing (or NGS) Toolbox, which is in beta at the time of development of
this tutorial, offers lots of new tools. We’ve started from the beginning
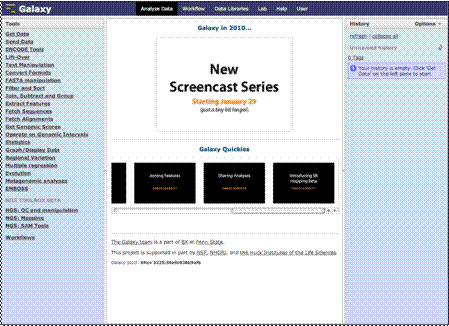
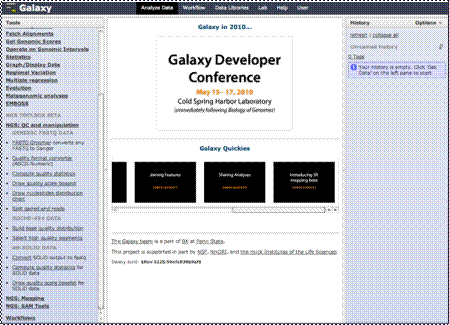
with a new history here. Let’s open the “QC and manipulation tools.” You’ll
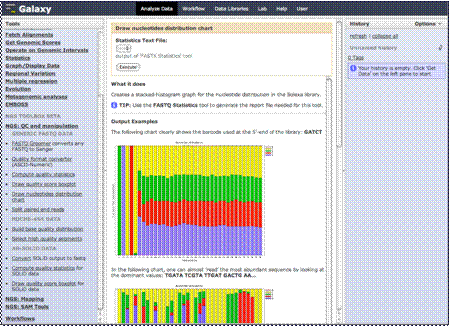
notice there are many tools here to choose from. For example, we could choose
to draw a nucleotides distribution chart from a statistics file we might have
uploaded. If you have NGS data to analyze, you might want to explore these a
bit closer.
|