|
1
|
- Shu-Jen Chen, Ph.D.
- Department of Biomedical Sciences
- Chang Gung University
- Jun. 3, 2011 (Friday 8:30 – 12:00)
|
|
2
|
|
|
3
|
- Compared to sequence information, biological function is much more
difficult to analyze.
- Biological data is fragmented
- Biologists currently waste a lot of time and effort in searching for
all of the available information about each small area of research.
- Language used in biological research is not well controlled
- This is hampered further by the wide variations in terminology that may
be common usage at any given time, which inhibit effective searching by
both computers and people.
|
|
4
|
- If you were searching for new targets for antibiotics, you might want to
find
- all the gene products that are involved in bacterial protein synthesis,
and
- that have significantly different sequences or structures from those in
humans.
- If one database describes these molecules as being involved in 'translation‘
while another uses the phrase 'protein synthesis', it will be difficult
for you - and even harder for a computer - to find functionally
equivalent terms.
|
|
5
|
|
|
6
|
|
|
7
|
|
|
8
|
|
|
9
|
|
|
10
|
|
|
11
|
- The Gene Ontology (GO) project is a collaborative effort to address the
need for consistent descriptions of gene products in different databases.
- The project began as a collaboration between three model organism
databases, FlyBase (Drosophila), the Saccharomyces Genome Database (SGD)
and the Mouse Genome Database (MGD), in 1998.
- Since then, the GO Consortium has grown to include many databases,
including several of the world's major repositories for plant, animal
and microbial genomes.
|
|
12
|
- What does the gene product do?
- Where and when does it act?
- Why does it perform these activities?
- GO uses “GO term” to represent these concepts
- Each gene is associated (annotated) with multiple “GO terms” to describe
its location and functions
- The information is stored in the GO database
|
|
13
|
- The GO project has developed three structured controlled vocabularies
(ontologies) that describe gene products in terms of their associated
biological processes, cellular components and molecular functions in a species-independent
manner.
- There are three separate aspects to this effort:
- development and maintenance of the ontologies
- annotation of gene products, which entails making associations between
the ontologies and the genes and gene products in the collaborating
databases
- development of tools that facilitate the creation, maintenance and use
of ontologies.
- The use of GO terms by collaborating databases facilitates uniform
queries across them.
|
|
14
|
- The Gene Ontology project provides an ontology of defined terms
representing gene product properties.
- The ontology covers three domains pertinent to the functioning of
integrated living units: cells, tissues, organs, and organisms.
- cellular component:
the parts of a cell or its extracellular environment
- molecular function:
the elemental activities of a gene product at the molecular
level, such as binding or catalysis
- biological process:
operations or sets of molecular events with a defined beginning
and end
|
|
15
|
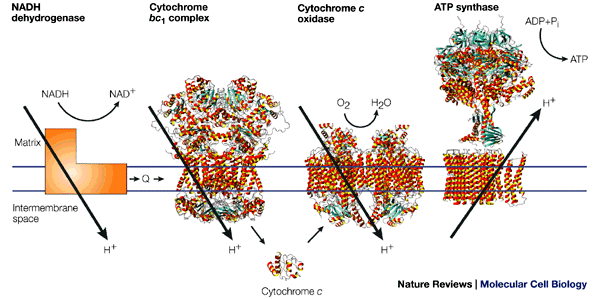
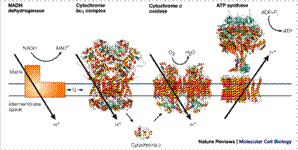
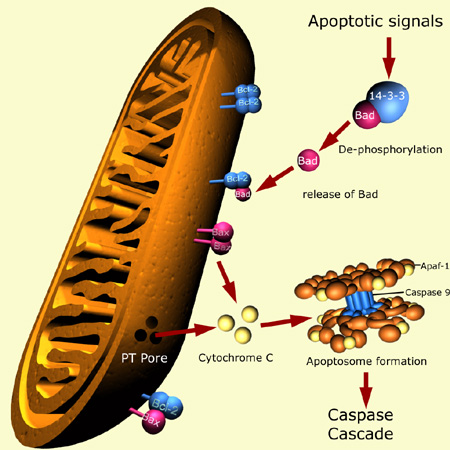
- The gene product “cytochrome c” can be described by the following GO
terms:
- molecular function:
oxidoreductase activity
- biological process:
oxidative phosphorylation and induction of cell death
- cellular component:
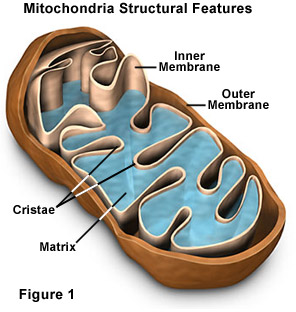
mitochondrial matrix and mitochondrial inner membrane
|
|
16
|
- The controlled vocabularies are structured so that they can be queried
at different levels.
- For example, you can use GO to find all the gene products in the mouse
genome that are involved in signal transduction, or you can zoom in on
all the receptor tyrosine kinases.
- This structure also allows annotators to assign properties to genes or
gene products at different levels, depending on the depth of knowledge
about that entity.
|
|
17
|
|
|
18
|
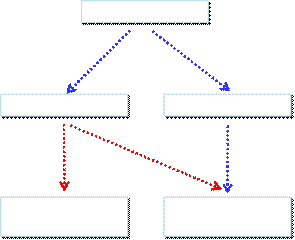
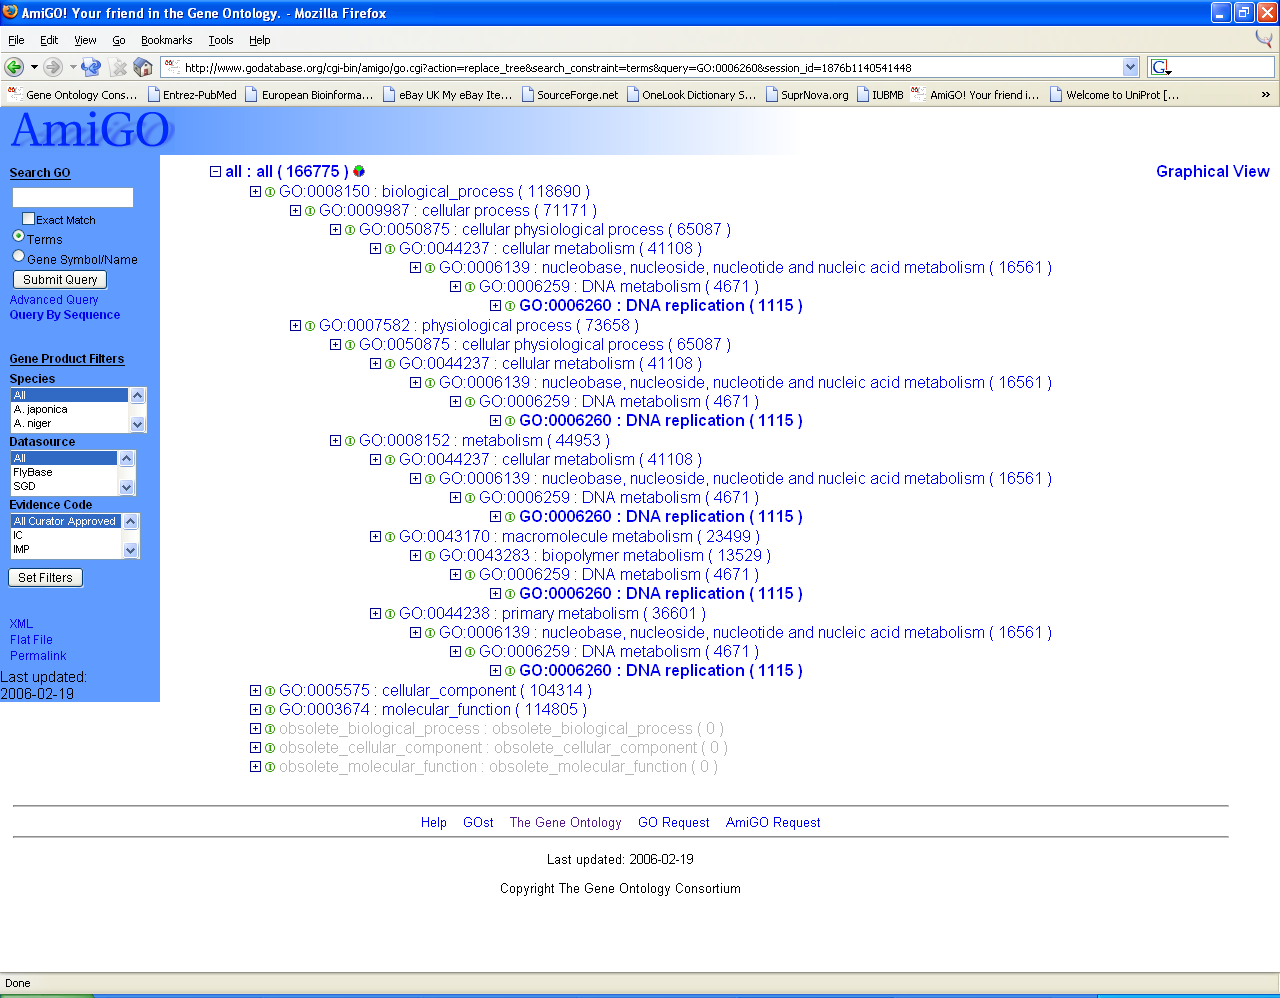
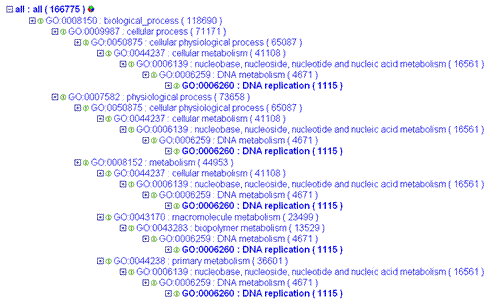
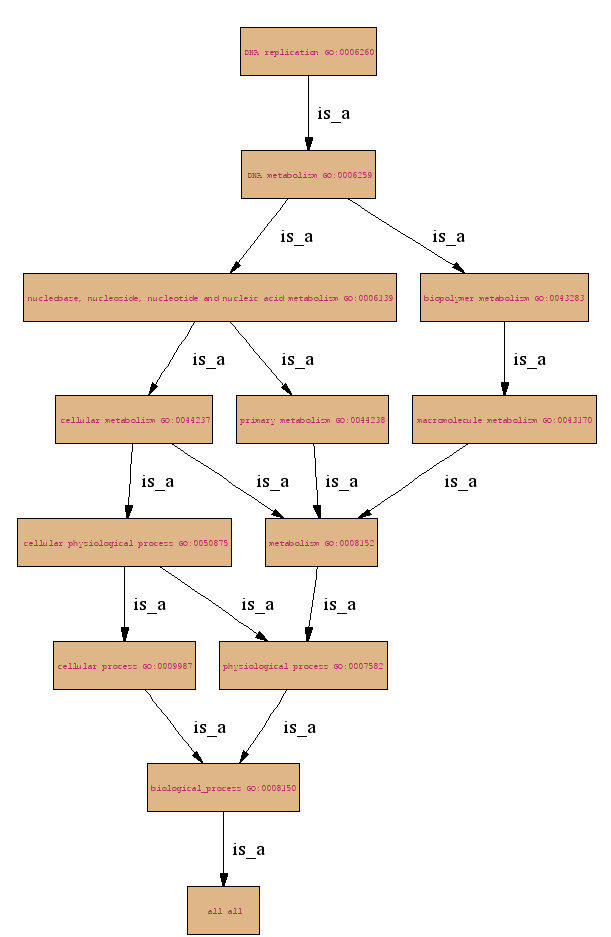
- The GO ontology is structured as a directed acyclic graph (DAC).
- Each term has defined relationships to one or more other terms in the
same domain, and sometimes to other domains.
|
|
19
|
|
|
20
|
|
|
21
|
- GO terms are divided into three types:
- Cellular component : where
and when does it act?
- Molecular function : what
does the gene product do?
- Biological process : why
does it perform these activities?
|
|
22
|
|
|
23
|
|
|
24
|
|
|
25
|
- Enzyme complexes in the component ontology refer to places, not
activities.
|
|
26
|
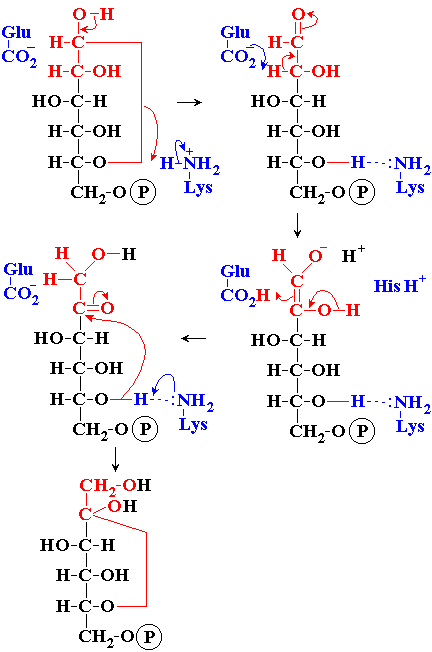
- A gene product may have several functions.
- A function term refers to a reaction or activity, not a gene
product
à How ?
- Sets of functions make up a biological process
à Why ?
|
|
27
|
|
|
28
|
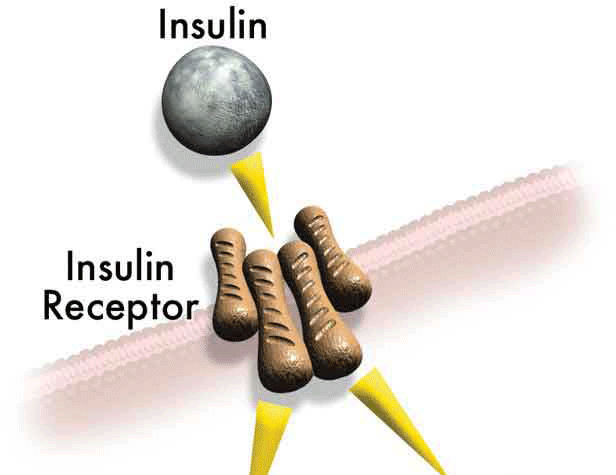
- insulin binding
- insulin receptor activity
|
|
29
|
- drug transporter activity
|
|
30
|
- a commonly recognized series of events
|
|
31
|
|
|
32
|
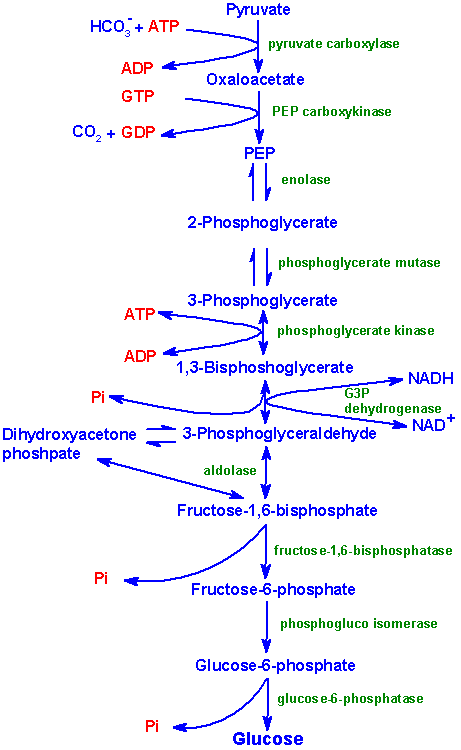
- regulation of gluconeogenesis
|
|
33
|
|
|
34
|
|
|
35
|
|
|
36
|
|
|
37
|
|
|
38
|
|
|
39
|
|
|
40
|
- The GO vocabulary is designed to be species-neutral, and includes terms
applicable to prokaryotes and eukaryotes, single and multicellular
organisms.
|
|
41
|
- Using GO to identify all genes involved in a specific biological
process.
|
|
42
|
|
|
43
|
|
|
44
|
|
|
45
|
|
|
46
|
|
|
47
|
|
|
48
|
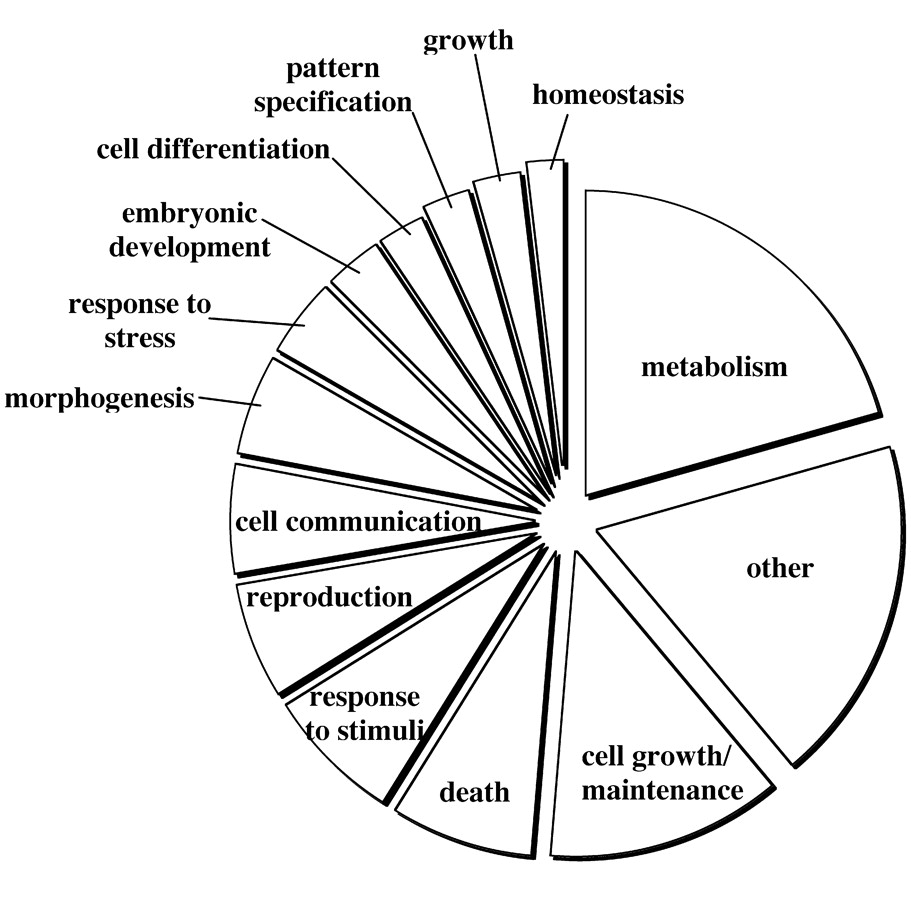
- Using GO to classify genes differentially expressed from microarray
study
|
|
49
|
|
|
50
|
- After searching all information about these 100 genes, it is still
difficult to know which biological processes are most significantly
altered
|
|
51
|
- But by using GO annotations, this work has already been done
|
|
52
|
|
|
53
|
|
|
54
|
|
|
55
|
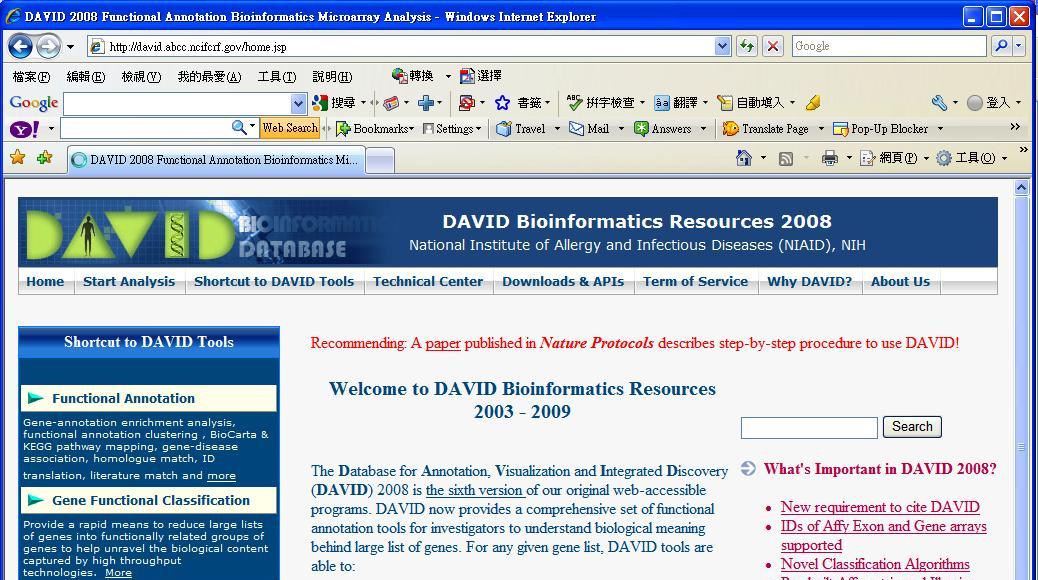
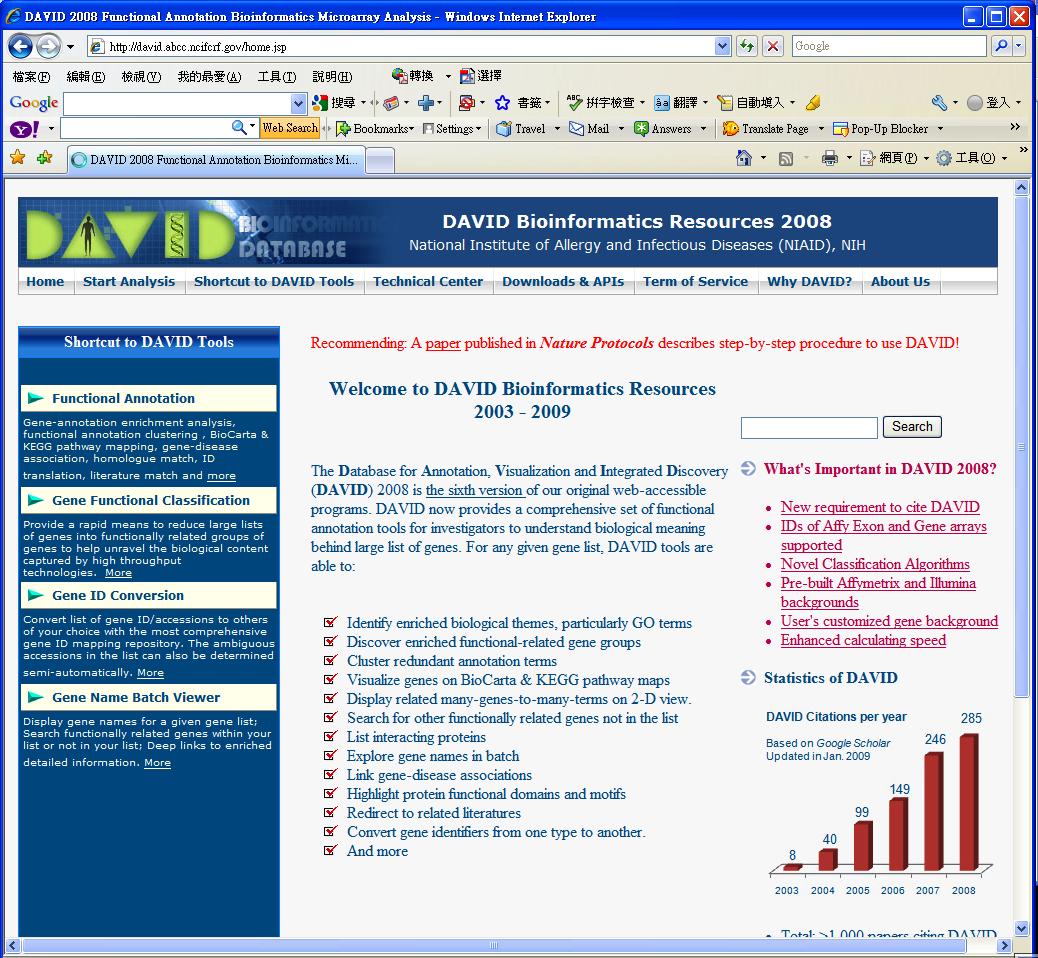
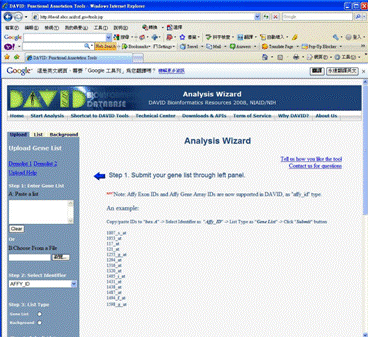
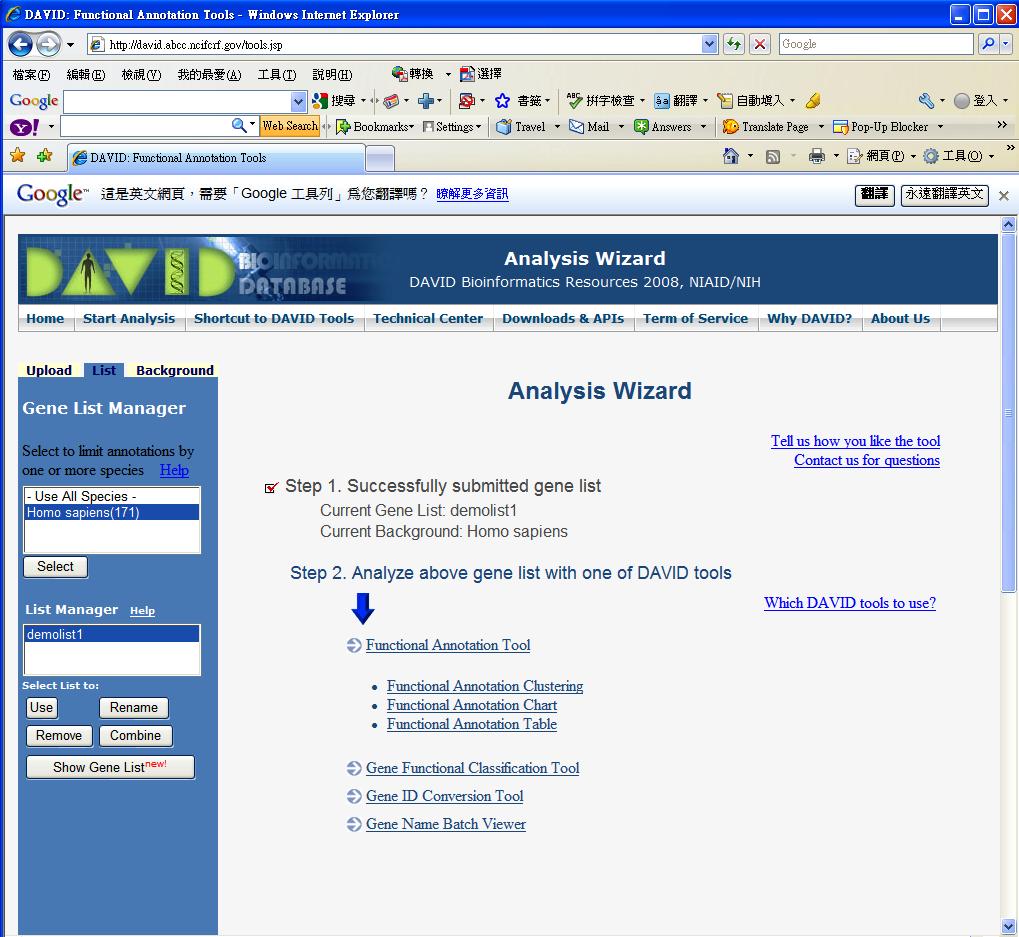
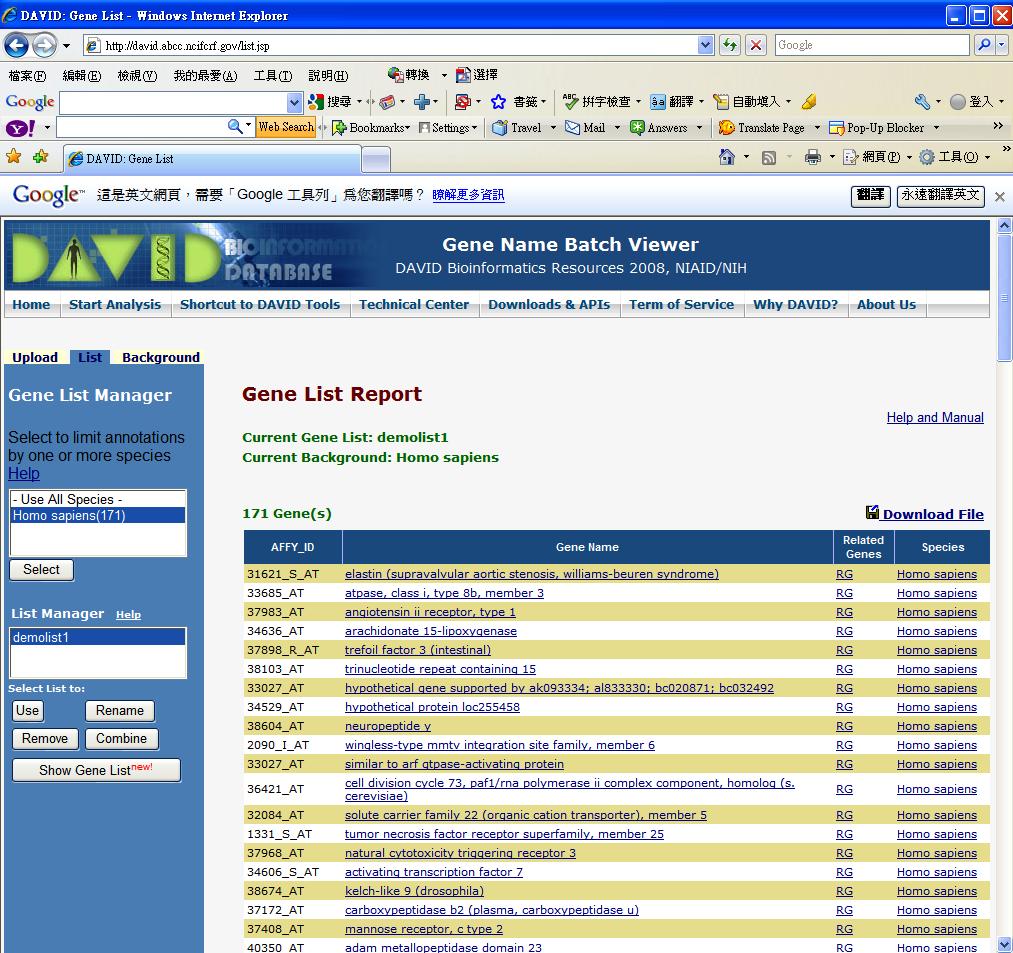
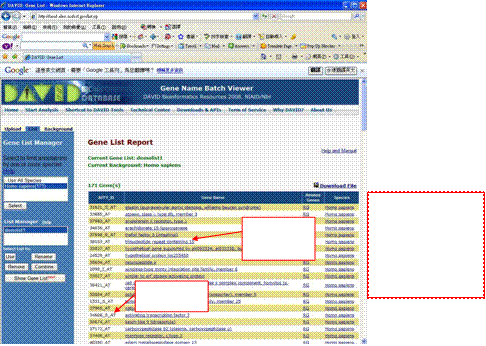
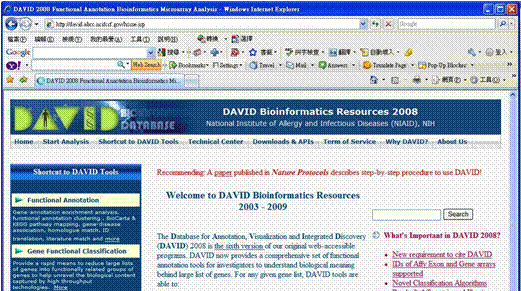
- DAVID web server : http://david.abcc.ncifcrf.gov/home.jsp
|
|
56
|
|
|
57
|
|
|
58
|
|
|
59
|
- Reasonable number of genes ranging from hundreds to thousands (e.g.,
100–2,000 genes), not extremely low or high.
- Most of the genes significantly pass the statistical threshold for
selection (e.g., selecting genes by comparing gene expression between
control and experimental cells with t-test statistics: fold changes ≥ 2
and P-values ≤0.05).
- A ‘good’ gene list should
consistently contain more enriched biology than that of a random list in
the same size range during analysis in DAVID.
|
|
60
|
- To decide the degree of enrichment, a certain background must be set up
to be compared with the user’s gene list.
- For example, 10% of user’s genes are kinases versus 3% of genes in human
genome (this is population background) are kinases.
- Thus, the conclusion is obvious in the particular example that the
user’s study is highly related to kinase.
- However, 10% itself alone cannot provide such a conclusion without
comparing it with the background information.
|
|
61
|
- A general guideline is to set up the reference background as the pool of
genes that have a chance to be selected for the studied annotation
category under the scope of users’ particular study
- Default background is the entire genome-wide genes of the species
matching the user’s input IDs.
- Pre-built backgrounds, such as genes in Affymetrix chips and so on, are
available for the user’s choice
- In principle, a larger gene background tends to give smaller P-values.
- As most of the high throughput studies are, or at least are close to,
genome-wide scope, the default background is good for regular cases in
general
|
|
62
|
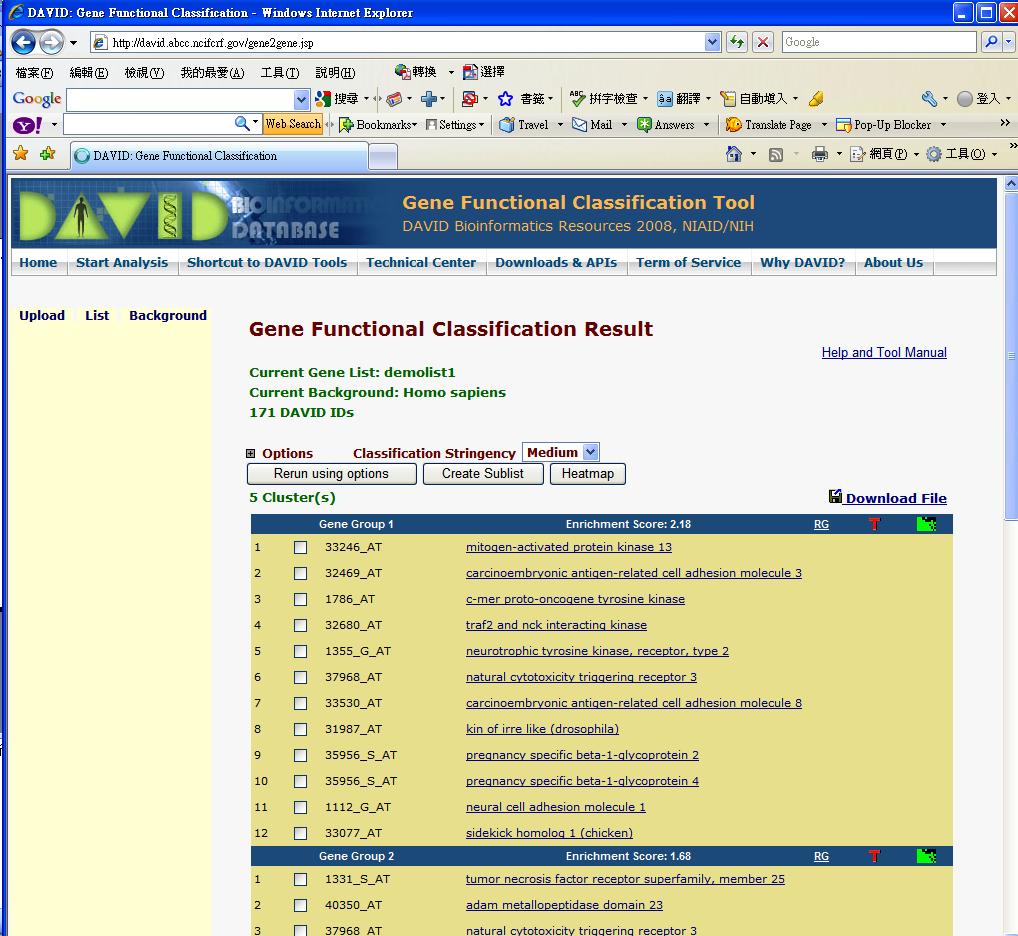
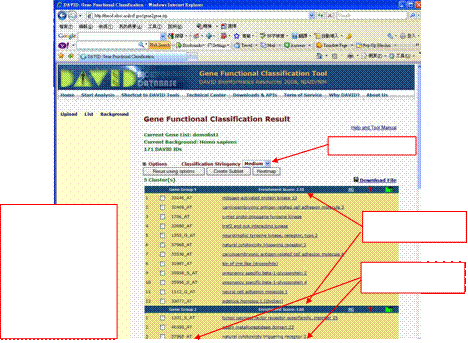
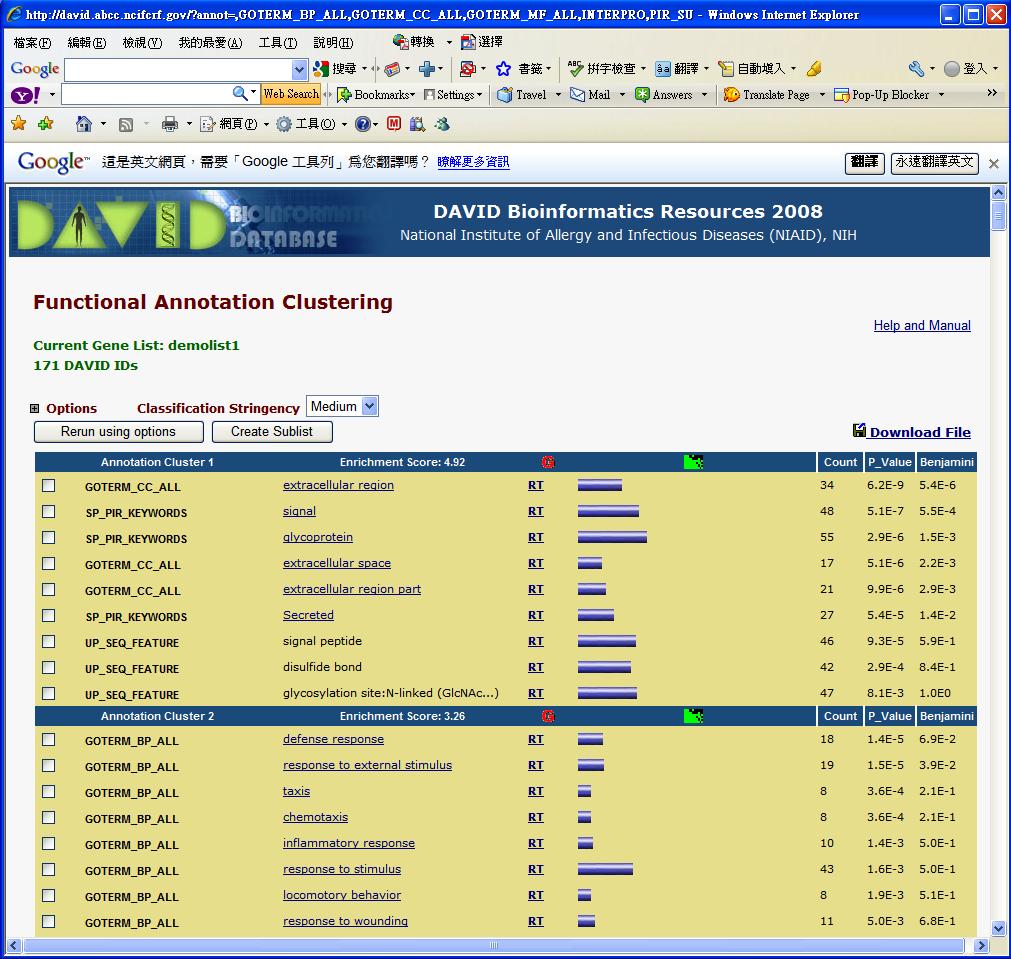
- To control the behavior of DAVID Fuzzy clustering
- A general guideline is to choose higher stringency settings for tight,
clean and smaller numbers of clusters; otherwise, lower for loose,
broader and larger numbers of clusters
- Default setting is medium
- Five predefined levels from lowest to highest for user’s choices
- Users may want to play with different stringency for more satisfactory
results
|
|
63
|
- To rank overall enrichment of gene groups.
- It is the geometric mean of all the enrichment P-values (EASE scores)
for each annotation term associated with the gene members in the group.
- To emphasize that the geometric mean is a relative score instead of an
absolute P-value, minus log transformation is applied on the average
P-values.
- A higher score for a group indicates that the gene members in the group
are involved in more important (enriched) terms in a given study;
therefore, more attention should go to them
|
|
64
|
- Enrichment score of 1.3 is equivalent to non-log scale 0.05. Fold
enrichment 1.5 and above are suggested to be considered as interesting.
- Caution should be taken when big fold enrichments are obtained from a
small number of genes (e.g., ≤3).
This situation often happens to the terms with a few genes (more
specific terms) or of smaller size (e.g.,<100) of user’s input gene
list. In this case, the reliability is not as much as those fold
enrichment scores obtained from larger numbers of genes
|
|
65
|
- To examine the significance of gene–term enrichment with a modified
Fisher’s exact test (EASE score).
- The smaller the P-values, the more significant they are
- Default cutoff is 0.1
- Users could set different levels of cutoff through option panel on the
top of result page.
- Owing to the complexity of biological data mining of this type, P-values
are suggested to be treated as score systems, i.e., suggesting roles
rather than decision-making roles.
- Users themselves should play critical roles in judging ‘are the results
making sense or not for expected biology
|
|
66
|
- To globally correct enrichment P-values to control family-wide false
discovery rate under certain rate (e.g., ≤0.05).
- It is one of the multiple testing correction techniques (Bonferroni,
Benjamini and FDR) provided by DAVID
- More terms examined, more conservative the corrections are. As a result,
all the P-values get larger
- It is great if the interesting terms have significant P-values after the
corrections.
- But as the multiple testing correction techniques are known as
conservative approaches, it could hurt the sensitivity of discovery if
overemphasizing them.
|
|
67
|
- Number of genes involved in given term is divided by the total number of
user’s input genes, i.e., percentage of user’s input gene hitting a
given term.
- For example, 10% of user’s genes hit ‘kinase activity
- It gives overall idea of gene distributions among the terms
- The higher percentage does not necessarily have a good EASE score
because it also depends on the percentage of background genes
|
|
68
|
- Fold enrichment and EASE score should always be examined side by side.
- Terms with larger fold enrichments and smaller EASE score may be
interesting.
|
|
69
|
|
|
70
|
|
|
71
|
|
|
72
|
|
|
73
|
|
|
74
|
|
|
75
|
|
|
76
|
|
|
77
|
|
|
78
|
|
|
79
|
- DAVID web server : http://david.abcc.ncifcrf.gov/home.jsp
|

 備忘錄