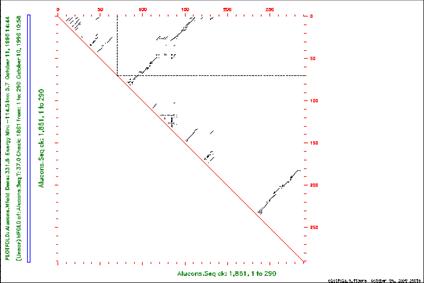
PLOTFOLD
B) p-num plot
This plot shows the amount of variability in pairing at each position in the sequence in all
predicted foldings within the increment of the optimal folding energy you specify