PLOTFOLD
A) sub-optimal
energy plot
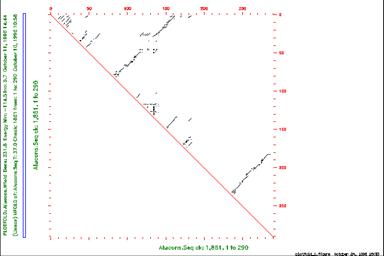
The energy dotplot indicates
all of the base pairs involved in all optimal and suboptimal secondary structures within
the energy increment you specify. The plot takes the form of a two-dimensional graph
where both axes of the graph represent the same RNA sequence. Each point drawn in
the graph indicates a base pair between the ribonucleotides whose
positions in the sequence are the coordinates of that point on the graph