|
|
|
So the first
question to be asked is what types of data are we trying to represent. And
what is the minimal information that can be given about a microarray
experiment to allow it to be reproduced and compared to other experiments.
This is the focus for the first standard: the minimum information about a
microarray experiment (MIAME).
|
|
|
|
First we will
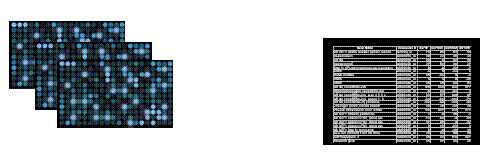
describe the raw data being processed. The raw data is generally provide as
image data, scanned from microarray chips produced from different
hybridizations. Some of these images may be from diseased samples, and some
from control (or normal) samples. The spots in these images are then
quantified, using image analysis software, and the results from this are put
into a quantification matrix (with one matrix for each image). The index
along one dimension of this matrix gives the actual spot being quantified on
the image, the other dimension gives different quantification measures such
as overall integrated intensity, spot size, medium intensity, etc. The
quantification matrices are then used to produce a single gene expression
data matrix. The gene expression matrix gives the overall expression value
for each gene, in each sample. The next slide will give more details about
the gene expression matrix.
|
|
|
|
There are a number
of reasons why this is a two stage process. There is not always a one-to-one
relationship between the quantification values in the quantification
matrices, and the gene expression values in the gene expression matrix, for
example:
|
|
|
|
1.The DNA may have been spotted in a number of locations on
the array (physical replicates). The quantification matrix gives different
values for each of these spots whereas they nee to be combined into a single
expression value in the gene expression matrix.
|
|
2.There may be a number of arrays hybridized to the same
sample (again physical replicates),
the quantifications from the same spots on these different arrays also
need to combined into a single expression value.
|
|
3.Different ‘regions' of DNA from the SAME gene may be spotted at
different locations on an array. These different measurements also need to be
combined into a single value for the expression level of this gene.
|