- Background
- Your Task: Working with graphics maps
In this chapter you will expand your knowledge of Molecule Display windows and will learn to edit the representation of molecule graphics maps. Although all operations will be demonstrated on DNA molecules, the techniques described here work equally well for protein molecules.
Your Task: Working with graphics maps
Your task will be to create a Molecule Display window for pBR322 and manipulate and save its graphical representation to a Molecule Document file.
Follow the steps in the order shown. Figures show what your screen should look like at various points along the way.
1. Launch Vector NTI
Launch Vector NTI by double-clicking its icon in the program group or folder in which you installed Vector NTI.
2. Open pBR322 in a new Display window
This time we will try the alternative way of opening database molecules. Activate the main workspace window by clicking on its window title (on Macintosh, click on its status bar). When the main workspace is activated, click the Open Nucleic Acid from Database button (  ) on the main toolbar to open a new Molecule Display window.
A dialog box appears, asking you to select a DNA/RNA molecule to be opened in a new Display window. Select the MAIN subbase in the combo box and click on the pBR322 molecule in the list, then press the OK button. A Molecule Display window opens, containing pBR322’s text description, sequence, and graphical functional and restriction maps.
3. Arrange the Display window conveniently
Arrange the Display window to your liking. It can be moved within the Vector NTI workspace using standard window manipulation techniques. You can move, resize, maximize, etc. Note that the Display window has two split bars dividing the window on three panes: text description of the molecule, the graphical map, and nucleotide sequence. You can move the split bars to allow more space for any pane at the expense of the other two panes.
Click the maximize box (  ) in the upper right corner of the Display window. The window expands to fill the entire Vector NTI workspace. Click anywhere on the blank space in the graphics pane to activate it. Now click the
  and
and  tools on the window toolbar while holding down the shift key to zoom graphics map until all labels are large enough to be easily readable. Use split bars and scroll bars to get a convenient display of pBR322’s graphics map.
4. Change the Arrangement Setup
Vector NTI automatically rearranges the graphics map when you change the set of restriction enzymes, edit functional map of the molecule etc. Sometimes you may want to force Vector NTI to arrange the graphics map (for example, if you have link mode turned on and change the set of visible features). To arrange the graphics map, click the Standard Arrangement button on the Window toolbar (  ). Vector NTI would move all symbols and labels to their standard locations, dependent on the current standard arrangement. To change the parameters of standard arrangement, hold down the ctrl key (Windows) or command key (Macintosh) and press the Standard Arrangement button. The Arrangement Setup Palette appears, where you can change the standard arrangement settings like size of labels and width of signals. When you are satisfied with the arrangement results, press the Standard Arrangement button again to close the palette.
5. Change The Graphics Setup of CDS signals
In addition to automatic arrangement, Vector NTI lets you format graphical maps manually and change the predefined display style for elements of feature and restriction maps. You can change the shape and drawing style of features, move and format text, add text annotations etc.
To modify the way CDS signals are displayed, click on one of the CDS signals in the graphics pane and choose the CDS Display Setup from the shortcut menu (as usual, click with the right button in Windows; hold the command button while clicking in Macintosh). The Graphics Display Setup dialog appears, allowing you to select graphics display styles for a selected feature type. When the dialog box appears, the CDS feature type is automatically selected; do not change this selection unless you want to edit styles for other feature types.
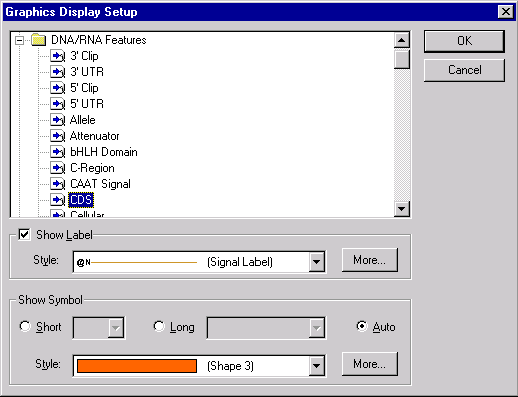
Vector NTI allows you to choose whether you want to display a label for this feature or not, and if you want to show a label, you may choose its style including font, color and text format. You may also choose the shape and style of symbol representing a feature.
Press the More button near the Label Style combo box. Vector NTI displays the Properties dialog. Click on the Font button and choose the bold font style and blue (or navy) color in the Font dialog. Press OK to close the Font dialog and choose the Line tab on the Properties dialog. On the Line page, choose some shade of blue color to match the font color. Press the OK button.
Vector NTI asks you whether you want to create a shared style that could be used for other feature types or specific style that would be used for CDS signals only. Press No to create a unique style named “CDS Label”. This style will only be available to format CDS features.
Let’s change the symbol style too. Click the More button near the Symbol Style box and choose the Fill tab. On the Fill page, select light blue color and press OK to close the dialog. This time when Vector NTI asks you what kind of style you want to create, choose Yes to create a shared style. Vector NTI assigns a sequential number to the new style (Shape 5) and will allow you to use this style to format not only CDS signals but other features as well.
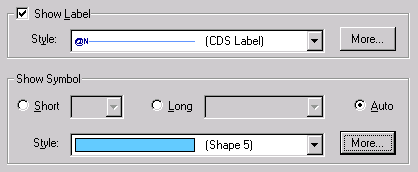
Press the OK button. Vector NTI closes the Graphics Display Setup dialog and automatically rearranges pBR322’s graphics pane to show the new display style for CDS signals.
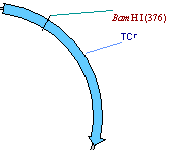
The style modification you just made has no effect on the molecules displayed in other Display windows. Vector NTI associates a style sheet with every Display window in the system; a style sheet is a collection of different kinds of display settings including graphics display settings you just modified, sequence settings like 1-letter or 3-letter translation, Feature map settings etc. All settings in the current style sheet are accessible from the Molecule Display Setup dialog you examined in the step 8 of the previous chapter.
To save your modified style sheet, click on the Display Setup button (  )on the Window toolbar and choose the “Save Settings As” command from the popup menu. Vector NTI allows you to enter your own name for the settings or use any of existing names displayed in the combo box.
Type the name “Blue” in the Save As dialog and press OK. If Vector NTI asks you whether you want to save unused styles, press No. Now your modified style sheet is saved and can be used to format other molecules.
Close all the display windows and reopen the pBR322 window. When it is first displayed, it uses the “(Default)” style sheet. Click on the Display Setup button on the Window toolbar. You will see that the list of available style sheets now has two elements: “(Default)” and “Blue”. Choose the “Blue” style sheet. Vector NTI rearranges the Display window to use the styles you chose; CDS signals are shown in blue.
6. Turn on the Picture Editing mode
In addition to style sheet editing, Vector NTI lets you format graphical maps manually and change the display style for individual features and elements of other graphical maps. You can change the shape and drawing style of feature symbols, move and format text, add text annotations etc.
The Vector NTI graphics pane can operate in two different modes: Molecule Editing mode (the default) and Picture Editing mode. In the Molecule Editing mode you use the graphics pane to work with the graphical maps as well as the sequence of a molecule. In the Picture Editing mode you manipulate the graphical representation of the molecule’s graphical maps. All the operations on the graphical representation do not change the molecule itself.
To switch the graphics pane into the Picture Editing mode, activate the graphics pane and press the Edit picture button (  ) on the Window toolbar. When in Picture Editing mode, Vector NTI changes the way it selects objects in the graphics pane: the elementary units of selection are graphics objects like labels and arrows, not the elements of the feature map or restriction map. Note, that Vector NTI automatically switches back to Molecule Editing mode as soon as you select the sequence fragment in a sequence pane or perform some operation on molecule.
7. Turn the TC(R) arrow to blue cross-hatching
Locate the TC(R) symbol on the graphics map. Let’s make the gene stand out better by changing its current pattern to cross-hatching and its color to light blue, and then enlarging the arrow.
First, make sure that the Picture Editing mode is on (the Edit Picture item in the View menu should have check mark near it ). Move the mouse to point at the arrow representing TC(R) (the mouse pointer changes its shape to a pointing hand) and double-click on the arrow. Vector NTI displays the Properties dialog with three tabs. Click on the Fill tab. The Fill page appears, asking you to select a pattern and color.
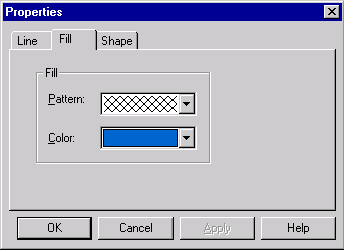
Click in the pattern box, and a list of allowable fill patterns appears. Find the cross-hatched pattern in the list, and click on it. Then click the down-arrow next to the color box. A list of allowable colors appears. Choose blue, and then press the OK button. Your orders are executed. Immediately after the color change, the arrow’s colors are inverted, showing that the signal is currently selected. Click in the graphical map outside the TC(R) arrow; this deselects TC(R), and the arrow shows its true color.
8. Enlarge the TC(R) arrow
Now let’s enlarge the TC(R) arrow to make it even more visible. Select the TC(R) arrow by clicking on it with the mouse. Notice that when the TC(R) arrow is selected, drag boxes appear at its corners.
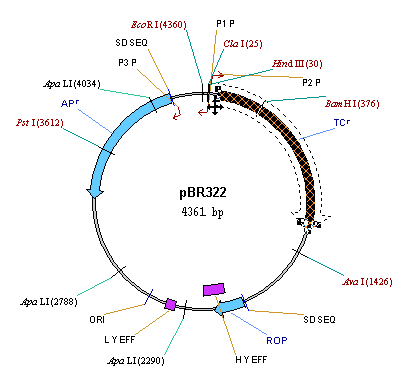
Move the mouse to the drag boxes at the tail of the arrow. The cursor turns to a thin four-pointed arrow (  ). Click and hold the left button on one of the drag boxes, and move the mouse a bit. The TC(R) arrow gets thicker or thinner as you move the mouse. Make the arrow thick so it will be more visible. The drag boxes at the front of the arrow are for changing the shape of the arrowhead. We will not use them for now, but feel free to experiment with them on your own.
You can drag the whole arrow radially inwards or outwards. Set the mouse in the middle of the TC(R) symbol so that the cursor changes to a thick four-pointed arrow (  ). Press and hold the left button and drag the mouse inward or outward, moving the arrow radially. You can also move the arrow around the circle, by pressing ctrl+shift (Windows) or option+shift (Macintosh) while dragging. We require the double key combination with the drag to prevent you from moving functional signals out of position on the graphical map by accident. Don’t forget that the operations on the picture in the Edit Picture mode do not modify the molecule itself. To change the location of the signal on the molecule’s graphics map you should edit the signal in the Molecule Edit mode as described in Chapter 2.
You can undo any changes you make in the graphical map by pressing the Undo button on the main toolbar (  ), or by pressing shortcut keys ctrl+z (Windows) or command+z (Macintosh).
9. Format TC(R)’s label
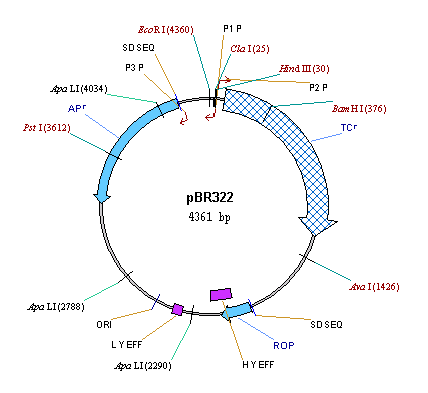
Now we will change the formatting of the TC(R) label to further emphasize the gene. Move the cursor to point at the TC(R) label and double-click on it. Vector NTI displays a Properties dialog with two tabs.
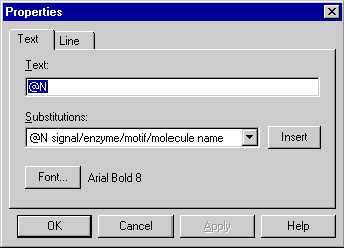
In the Text page, press the Font button and set the font to 18-point bold italic in the Font dialog box. Press the OK buttons in both dialogs, and the change is made. You can also move labels around the graphics pane with the mouse. Drag the TC(R) label somewhat to the right of its initial position. Drag some other labels to convenient places on the screen.
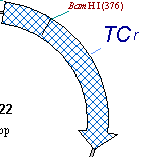
Pressing the Standard Arrangement button on the toolbar (  ) would return all symbols and labels to their standard locations. If the picture was modified, Vector NTI displays a confirmation dialog before proceeding.
10. Add a text annotation
Now let’s add a text note indicating that TC(R) is to be cloned into pUC19. Click the “paper clip” button in the window toolbar (  ) to add an annotation. The Annotation dialog box appears. Enter the words “Clone into pUC19” into the Annotation Text field and press the OK button. Your text appears just above the center of the molecule. Double-click on the annotation and press the Font in the Properties dialog. Change the font and font size in the Font dialog box. Press the OK buttons in both dialogs, and the font is changed. Drag the annotation directly under the TC(R) label.
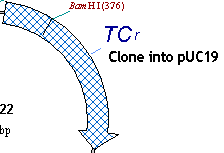
Once added, an Annotation can be removed by selecting it and choosing the Delete Annotation command from the Edit menu.
11. Experiment with Styles
Now we will continue experimenting with styles, which allow us to assign a single format to many objects in a centralized, organized fashion.
pBR322 has 3 CDSs, TC(R), AP(R) and ROP. On the graphical map, locate all three CDSs and their labels. Remember, that on step 5 we assigned the unique style “CDS Label” to be used to format all CDS labels. Since then we edited the TC(R) label and now its format attributes are different from those prescribed by the style “CDS Label” style. Vector NTI permits graphics objects to be formatted differently than prescribed by their styles; this simplifies graphics map editing and allows one to change a style using the formatted object as a template.
Click on the TC(R) label and call up the associated shortcut menu (as usual, this requires right-click on Windows and command-click on Macintosh). Notice, that this menu contains the “Redefine ‘CDS Label’ Style by Example” menu item. This item is enabled because the format attributes of the TC(R) label are different from those prescribed by its style. Execute the “Redefine…” command.
The style is changed; notice that all three CDS labels automatically change format as well.
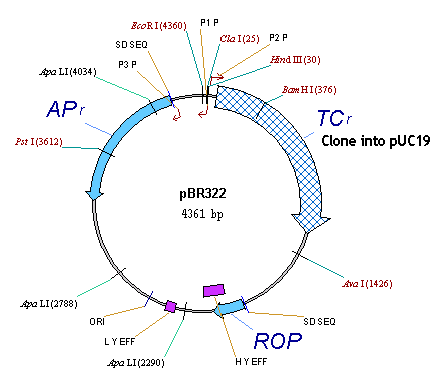
Note When you redefine the style using a certain graphics object as a template, all the attributes of the template object are copied to the style and from it to all other objects of that style. In our example the CDS Label style inherits the font from the selected label and spreads it to all labels of this style. Alternatively, you can copy attributes from object to object using the Copy Style and Paste Style commands from object’s shortcut menu.
You can use styles for automatic formatting of functional symbols—arrows, blocks, etc.—as well as for text. The style for graphics objects can store not only color and pattern attributes, but also geometrical characteristics such as width and arrowhead dimensions. This is a powerful feature for creating publication-quality figures.
Note Notice that in spite of the fact that the graphical representation of pBR322 in the Display window was changed, Vector NTI does not mark the window as modified (its name in the caption bar is not followed by the star symbol). Vector NTI does not store graphical representations of molecules and results of molecule analysis in the database; the molecule in a window was not changed and it is exactly the same as in the Vector NTI database.
12. Save the pBR322 Molecule Display to a Molecule Document file
To save all the information contained in the Molecule Display window, including graphical representations of a molecule and results of molecule analysis, you should save the contents of the Molecule Display window in a Molecule Document file. Let’s save the current contents of the pBR322 window. From the Molecule menu, choose the Save as Document command.
A dialog box appears, asking you for a filename. Name the file “pBR322.gb” (Windows) or “pBR322” (Macintosh) and press the OK button (Windows) or the Save button (Macintosh). The molecule is saved in a document file. If Vector NTI was configured for Internet publishing, a confirmation dialog appears asking your permission to create an HTML file describing the molecule. Press Yes and Vector NTI will notify you that an HTML file was created.
Note The Molecule Document file you created is completely independent of the Vector NTI database; it contains all the molecule information (its nucleotide sequence, functional and restriction map) as well as the results of molecule analysis and the graphical representation of the molecule. You can think of a Molecule Document as a self-contained “snapshot” of your work with a molecule. You can exchange Molecule Documents with your colleagues, publish them on the Internet, send them through electronic mail, etc.
Let’s close the pBR322 molecule window. From the Molecule menu, choose the Close command.
At this moment Vector NTI detects that the style sheet associated with the pBR322 Display window has changed (you may recall that we redefined the “CDS Label” style) and displays the confirmation dialog allowing you three choices: save the modified style sheet, discard the modifications or cancel the close operation.
Let’s save the modified style sheet under its original name. Click “Yes” in the confirmation dialog, select “Blue” from the Settings Name combo box in the Save Current Display Settings As dialog and press the OK button. Since we already have style sheet named “Blue” Vector NTI asks to confirm the save operation. Choose “Yes” to overwrite the original “Blue” style sheet with the modified one.
After the modified style sheet is saved, Vector NTI closes the pBR322’s Display window.
Now open the Molecule Document you created. From the Molecule menu, choose the Open Document command, and select the name of the saved document file from the file list. Your Molecule Document opens, and all your changes have been preserved.
Note Vector NTI does not use any of the available style sheets to format Display windows for Molecule Documents because every style required by a document is saved within the document itself. This means that, unlike molecules opened from the database, the pBR322 molecule document will always look the way you formatted it before saving to a file.
Notice that the window title now reflects the fact that the Molecule Display window displays the molecule data from the document, not from the Vector NTI database. You can modify the molecule in this Display window and save it back to the Molecule document; the version of pBR322 in the database will remain unchanged.
Note Vector NTI does not support the whole range of molecule operations on the molecules in Molecule Documents. Vector NTI will prompt you to save the molecule into the database first and repeat the operation on the molecule saved in the database. The Demonstration version has extra restrictions on the kind of operations you can perform on such “external” molecules.
13. Using the saved style sheet to format Molecule Display windows
Now we can use the saved settings to format other molecules as well. Close the pBR322 Display window and click on the Open Molecule from Database button on the main toolbar. In the Database Molecules dialog press the Display Setup button. The Molecule Display Setup dialog appears. Select “Blue” style sheet from the Setup Profile list and press the OK button. Now select M13 molecule from the molecule list and press the OK button. Vector NTI opens a Molecule Display window for the M13 molecule from the database. Notice that all CDS labels have the formatting we defined in a “CDS Label” style.
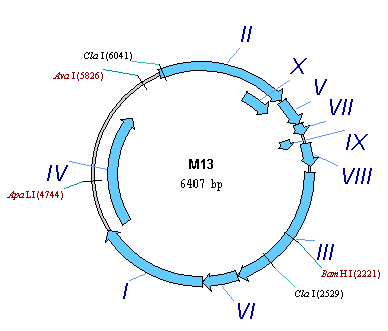
You can define and give name to several independent Display Setup settings like “Blue” and use them to reformat graphics representation of molecules in Molecule Display windows. To switch to another style sheet, click on the Display Setup button in the Window toolbar, and select the name of the style sheet in the popup menu. Vector NTI will reformat the active Display window according to setting you chose.
14. Close the Display window and exit Vector NTI
You have finished your session with Vector NTI. Close the Molecule Display window using the Close command in the Molecule menu. Then quit Vector NTI with the File menu’s Exit command (Windows) or Quit command (Macintosh).
This concludes Chapter 3 of the Vector NTI tutorial. You have begun working with graphical representation of molecules, and have manipulated display styles and saved styles to the Display Setup data set.
See Also:
Chapter 11 -- Display Windows and User Interface
Chapter 1 -- Display Windows
Chapter 6 -- PCR Analysis
Introduction
Chapter 14 -- Molecule Components and Construction
Chapter 15 -- Database Operations
Back to Index