|
|
|

|
Click |
To |
|
|
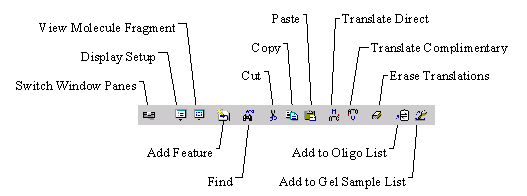
Switch window panes |
|
|
Change parameters of the active Molecule window (menu) |
|
|
View molecule fragment (menu) |
|
|
Find the selected object on graphics map |
|
|
Link graphics display to open folders of text pane |
|
|
Expand current folder |
|
|
Expand current folder and all subfolders |
|
|
Collapse current folder and all subfolders |
|
|
|
|
|
Add selected oligonucleotide to the Oligo List |
Graphics pane toolbar
|
Click |
To |
|
|
Switch window panes |
|
|
Change parameters of the active Molecule window (menu) |
|
|
View molecule fragment (menu) |
|
|
Add new feature to feature map |
|
|
Setup graphics display attributes |
|
|
Find sequence |
|
|
|
|
|
|
|
|
Scale the graphics to 150% of current magnification |
|
|
Scale the graphics to 50% of current magnification |
|
|
Scale the graphics to fit to pane window |
|
|
Arrange graphics objects in standard layout |
|
|
Translate selection on direct strand |
|
|
Translate selection on complimentary strand |
|
|
Add a new fragment to Goal List using Fragment Wizard |
|
|
Add selection to the Oligo List. |
|
|
Add selected fragment to the Gel Sample List. |
|
|
Turn on/off the Picture Editing mode |
|
|
Sequence pane toolbar
|
Click |
To |
|
|
Switch window panes |
|
|
Change parameters of the active Molecule window |
|
|
Open a new Viewer for selected data from the active Viewer. |
|
|
Add a new feature to feature map |
|
|
Find sequence |
|
|
Cut the selected sequence and put it on the Clipboard |
|
|
Copy the selected sequence and put it on the Clipboard |
|
|
Insert the Clipboard contents at the caret point |
|
|
Translate selection on direct strand |
|
|
Translate selection on complementary strand |
|
|
Erase all translations on both strands |
|
|
Add selection to the Oligo List. |
|
|
Add selection to the Gel Sample List. |
Molecule
Display windows
Molecule Display windows are Vector NTIs mechanism for inspecting and editing molecules text descriptions, graphical maps, and sequences. They are powerful graphical tools, allowing you to manipulate and analyze DNA/RNA and protein molecules stored in Vector NTIs database, visually select fragments of DNA molecules for recombination, and prepare publication-quality figures.
You can open a Molecule Display window for a molecule from the Vector NTI database or a molecule from external file in one of several formats recognized by Vector NTI. When the window is open, you may specify the molecule information you would like to see. A Molecule Display window shows text information, including molecule description, features, as well as a graphical map of the molecule and its sequence. For DNA/RNA molecules you can also see restriction sites, ORFs, motifs, PCR analysis, etc.
A Molecule Display window has two modes of operation: the Molecule Editing mode (this mode is a default) and the Picture Editing mode. When the window is in the Molecule Editing mode, you can modify the molecules feature map and restriction map (DNA/RNA molecules only) and edit the molecules sequence. In the Picture Editing mode you can modify the graphical representation of the molecule. This allows you to create publication-quality illustrations. The modifications of the graphical representation of a molecule will not be reflected in the actual molecules data. You may save the molecule to the database or to an external file. When you save a molecule to the database, Vector NTI does not save its graphical representation. When the molecule is opened again, its graphical representation will be generated automatically from molecules data. To save the graphical representation of a molecule along with the molecule data you need to save the Display window to a Molecule Document file. Vector NTIs Molecule Document files contain all the information from Molecule Display windows, including the molecule picture, ORFs, motifs, PCR analysis results, etc. Molecule Document files are described in detail later in this Chapter.
The elements of a Molecule Display window
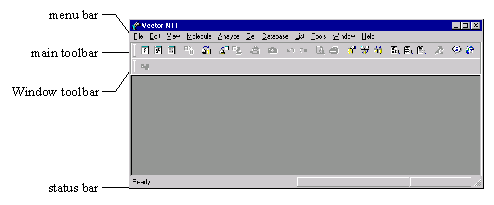
A Display window is a window which you create within Vector NTIs workspace. As such, you can manipulate the Display window within the workspace using standard window manipulation techniques. You can move the window, change its size, maximize it, etc.
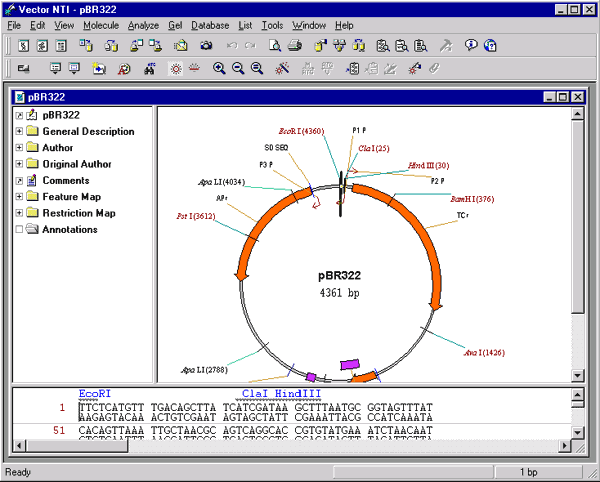
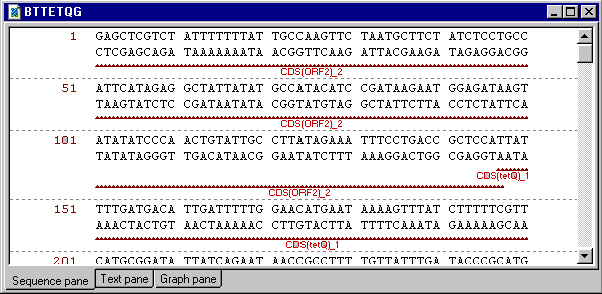
Each Molecule Display window is divided into three sections, or panes: a text pane, a graphics pane, and a sequence pane.
The title bar of a Molecule Display window shows the name of the database molecule if the window displays a database molecule, or the name of the file if the window displays the contents of a molecule file.
Two split bars separate the text pane, graphics, and sequence pane. You can drag split bars to change the sizes of the three panes of the Display window.
Each pane has its own scroll bars, allowing you to move up and down and left and right through the pane.
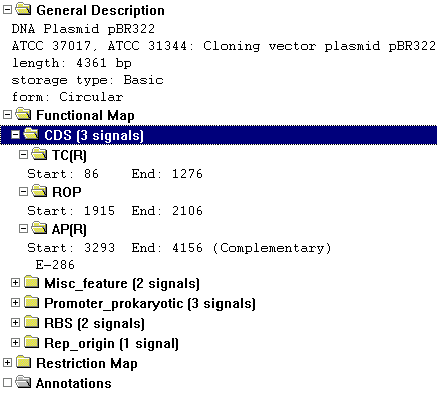
The text pane holds folders containing descriptions of the molecule shown in the Display window.
The graphics pane shows a graphical depiction of the molecule. Features, restriction sites, motifs, etc. are shown by symbols, and each symbol usually has a label connected to it by a dropline.
The sequence pane of a DNA/RNA molecule Display window shows the nucleotide sequence (both direct and complementary strands), with selected functional signals, restriction sites, motifs, ORFs, and protein translations if requested. Phase indicators in the left margin of the sequence pane show the phases of translations and ORFs relative to the start of the corresponding strand of the molecule.
The sequence pane of a protein molecule Display window shows the amino acid sequence and selected features.
PaneManager
In all applications of the Vector NTI Suite, you can organize the layout of the panes however you want. This version is unlike any other previous version in that it gives you full control of the panes layout. You can create your own panes layout, select from a set of predefined layouts, or maximize the active panes during one edit/view session. This technology also stores the current panes layout and restores it when you open any new session.
Pane layout elements
The PaneManager supports three main types of relative pane positions
Horizontal:
Vertical:
Tabular:
In your layout you can arrange these types in any combination that you choose.
Panes layout editor
The panes layout editor is a special dialog box for creating/modifying the panes layout or selecting a predefined pane layout from the list. For access to the panes layout editor use the menu View|Change panes layout.
The main elements of the PaneManager editor dialog box are the hierarchy layout tree, the preview panel, and the combo box (with list of predefined layouts).
The common element of this editor is the hierarchy layout tree. This tree presents the current layout, while the node (Vertical, Horizontal, or Tabular) describes the relationship between the panes.
The main operations under the hierarchy tree can be accesed by right clicking (Control click for Macintosh) on any one of the nodes (Vertical, Horizontal and Tabular) or leaves (Text, Graph, or Sequence Pane). This pop out menu provides the following abilities:
Change Layout - For Vertical, Horizontal, or Tabular nodes, this operation changes the relationship between underlying leaves.
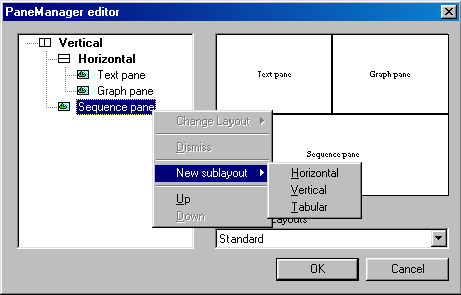
Dismiss - This operation does not affect the root node. It removes the selected node, and will shift all of the underlying leaves to control of the root node. E.g. If you dismissed horizontal in the above graphic, the Text, Graph, and Sequence Panes would all be displayed vertically.
New sublayout -This will add a new node in the designated area.
Up - This will move the node or leaf up in the tree.
Down - This will move the node or leaf down in the tree.
You can also change parent node for any node or leaf. All you have to do is just drag the node or leaf and drop it to new parent node.
Note: You cannot add or delete a pane leaf. You can only move these leaves and configure their output.
The preview panel of the editor shows the layout for the current state of the hierarchy tree. This panel is immediately redrawn after the state of the hierarchy tree is changed.
The Predefined Layouts box contains a list of predefined pane layouts. When you select one of the predefined layouts the preview panel will show the new state immediately.
Press the OK button after editing the layouts to apply your changes to the real panes or press CANCEL to discard your changes.
Show Maximized
By utilizing the Show Maximized feature, you can look at any pane (sequence, text, or graphics) on a full screen. A tabular control will then allow you to look at the other panes whenever you want. This mode is helpful if you want to maximize current panes of you work, or if you constantly want to switch panes for any reason.
Switching between Display window panes
In order to manipulate the information in a pane of a Display window, that pane should be the active pane.
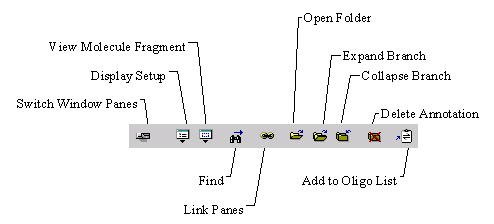
You can change the active pane with the Switch Panes buttons ( ![]() ,
, ![]() , or
, or ![]() ) in the Window toolbar or by clicking the mouse anywhere in the pane you want to activate. If you activate a pane by clicking the mouse, any selection present in a graphics or sequence pane will be turned off.
) in the Window toolbar or by clicking the mouse anywhere in the pane you want to activate. If you activate a pane by clicking the mouse, any selection present in a graphics or sequence pane will be turned off.
Linking the Display window panes
You can link the panes of a Molecule Display window to give the text pane control over the information displayed in the graphics and sequence pane.
To link a Display windows panes, make the text pane active and press the Link Panes button ( ![]() ) on the Window toolbar.
) on the Window toolbar.
When the panes are linked, information whose folder is open in the text pane is displayed in the graphics and sequence pane. Information whose folder is closed is not displayed in the graphics and sequence pane.
When the panes are linked, certain minimum information is always displayed. For graphics panes, the nucleic acid / protein representation, molecule name and length are always displayed, regardless which folders are open. For sequence panes, the nucleotide or amino acid sequence is always displayed.
Linking panes is a powerful capability for viewing graphical maps. It allows you to reduce clutter, displaying only those objects that are important to your current task. A secondary function is to allow you to display symbols that are hidden by Vector NTIs Standard Arrangement of graphics objects. The Standard Arrangement of DNA/RNA molecules graphics displays a maximum of 70 restriction sites plus 70 motifs. These are displayed so as to show as many different enzymes and motifs as possible. If one site of an enzyme or motif is displayed, all sites of that enzyme or motif will be displayed in the Standard Arrangement.
You can override these limits by linking the panes and opening the text folders for the signals whose every occurrence you want to display.
You can use linked panes to create attractive publication-quality figures without switching to the Picture Editing mode and editing the picture manually. With the panes linked, close all folders, then open the folders of the signals you want to display, and finally perform a Standard Arrangement. Symbols and labels will be distributed to take maximum advantage of available space.
Opening molecules in Molecule Display windows
Vector NTI can open molecules from two sources. You can open a molecule from Vector NTIs database or you can open a molecule from a file in one of the formats, recognized by Vector NTI: Vector NTI Molecule Document, GenBank/GenPept, EMBL/SWISS-PROT, FASTA, and sequence.
Opening a molecule from the database
Vector NTI workspaces main toolbar has two buttons allowing you to open database molecules. To open a DNA/RNA molecule in a Molecule Display window, press the Open Nucleic Acid From Database button ( ![]() ) on the main toolbar or choose the Open From Database4
DNA/RNA command from the Molecule menu. To open a protein molecule in a Molecule Display window, press the Open Protein From Database button (
) on the main toolbar or choose the Open From Database4
DNA/RNA command from the Molecule menu. To open a protein molecule in a Molecule Display window, press the Open Protein From Database button ( ![]() ) on the main toolbar or choose the Open From Database4
Protein command from the Molecule menu.
) on the main toolbar or choose the Open From Database4
Protein command from the Molecule menu.
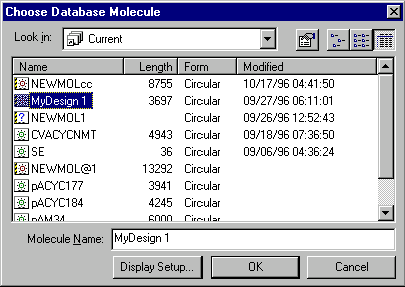
A dialog box will appear, asking you to choose the molecule from the database that you would like to be opened in a new Display window.
The drop-down combo box shows the subbases (subgroups) of the main database. Select the subbase that contains the molecule you want to see in the new Display window.
The list shows the molecules in the subbase selected in the combo box. Select the molecule that you want to see in the new Display window. The molecule name will show up in the text box below. Alternatively, you can type the name in the text box.
The Display Setup button allows you to modify the default set of parameters used to create the Molecule Display window contents. For DNA/RNA molecules it is features, restriction endonucleases, motifs, ORFs, and graphics styles. For protein molecules this set consists only of features and graphics styles.
Press the OK button. The new Molecule Display window will show the molecule you chose.
Opening a molecule from a Molecule Shortcut file
Vector NTI allows you to create special Molecule Shortcut files which contain the name of a database molecule along with the Display Setup parameters. When you open a database molecule via the Shortcut file, Vector NTI will use the Display Setup parameters stored in the file.
To open a database molecule via a Shortcut file, choose the Create Shortcut command from the Molecule menu and select the name of the Shortcut file from the file list.
Opening a molecule from a Molecule Document file
You can open a molecule saved in a Molecule Document file. Molecule Documents are useful if you want to save all the information contained in a Molecule Display window such as graphical representation and molecule analysis results as well as the molecule itself in a portable format suitable for information exchange. The Molecule Document format is based on GenBank/GenProt, so that not only Vector NTI but also any other program able to import GenBank/GenProt files could import Molecule Documents.
To open a molecule from a Molecule Document file, choose the Open Document command from the Molecule menu and select the name of the Document file from the file list. Vector NTI will open the file in a new Display window. Note, that in order to be able to perform the whole range of molecule operations on a molecule from a Molecule Document, you need to save the molecule to the Vector NTI database. Vector NTI restricts the set of operations you can perform on molecules opened from external files.
Opening a molecule from a GenBank/GenPept, EMBL/SWISS-PROT or FASTA file
Vector NTI allows you to open molecules from several popular file formats, namely GenBank, GenPept, EMBL, SWISS-PROT, and FASTA. Vector NTI also supports some variations of these formats (e.g., GCGs GenBank format, GenBank files with an e-mail header, etc.). See Chapter 15, Import section for more format details.
Opening the molecule from an external file is an alternative to importing the molecule into the Vector NTI database. When you open a molecule, Vector NTI creates a new Display window to show the molecule; this is useful if you want to take a look at the molecule before saving it into the Vector NTI database. You still need to save the molecule in the database to analyze it, construct other molecules from it, etc.
To open a molecule from an external file, choose the Open Molecule From Text File command from the File menu and select the type of file and the name of the file from the file list.
Opening a molecule from a sequence file
Vector NTI allows you to open nucleotide and amino acid sequence files in one of several formats as an anonymous molecule. See the Chapter 14 for sequence format requirements.
To open a molecule from an external sequence file, choose the Open Sequence From Text File command from the File menu and select the name of the file from the file list.
Viewing a selected molecule region
Although Vector NTI always opens a Display window for a molecule as a whole, you can configure the window to show only the fragment of the opened molecule. This is useful if you want to manipulate a small region of a larger molecule.
To view a selected molecule region, activate a graphics or sequence pane showing the molecule and select the region of the molecule you want to view in a Display window. (Section Manipulating the selection zone describes how to select a region of a molecule.)
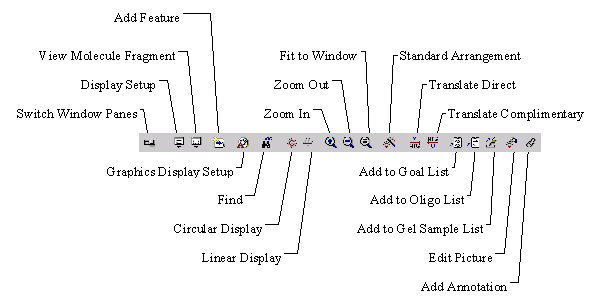
Click on the View Molecule Fragment button ( ![]() ) on the Window toolbar and choose the View Selection command from the popup menu, or choose the View Selection command from the View menu.
) on the Window toolbar and choose the View Selection command from the popup menu, or choose the View Selection command from the View menu.
The Display window is updated. It will show the selected region of the original molecule in the graphics and the sequence pane. The list of functional signals, restriction sites and motifs in the text pane will be updated to display only those objects that are located inside the selected region.
To return to the view of the whole molecule, click on the View Molecule Fragment button again and choose the View Whole Molecule command from the popup menu.
Molecule Display window setup
When you open a Molecule Display window for a molecule, Vector NTI uses a certain set of parameters to create the Molecule Display window contents. These include features, restriction endonucleases, motifs and ORFs for DNA/RNA molecules and features alone for protein molecules. This set is called a Display Setup. Vector NTI allows you to edit the Display Setup for a Display window any time after the window is created, assign names to different settings and store them in a Setup profile, change the default Setup settings, etc.
To change the setup for a Display window, activate the window and press the Display Setup button ( ![]() ) on the Window toolbar. The popup menu is displayed containing the Display Setup command, the Save Settings As command, and commands allowing one to load any of the named setups stored in the Display Setup Profile. Choose the Display Setup command. The Display Setup dialog box will appear.
) on the Window toolbar. The popup menu is displayed containing the Display Setup command, the Save Settings As command, and commands allowing one to load any of the named setups stored in the Display Setup Profile. Choose the Display Setup command. The Display Setup dialog box will appear.
The Display Setup dialog has two modifications: one for DNA/RNA molecules Display windows, another for proteins Display windows.
In the Display Setup dialog you can choose the information you would like shown in the Display window:
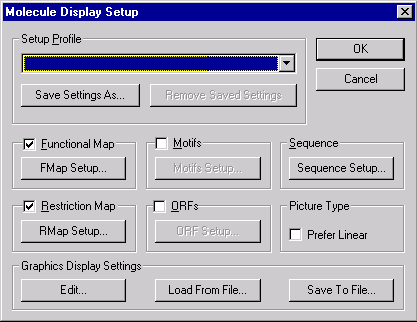
Use the check boxes to indicate what information the Molecule Display window should display. If you check the Prefer Linear box, Vector NTI will start from linear display for both circular and linear molecules. Use the Setup buttons to indicate in more detail what information should be displayed for each category.
Feature Map Setup
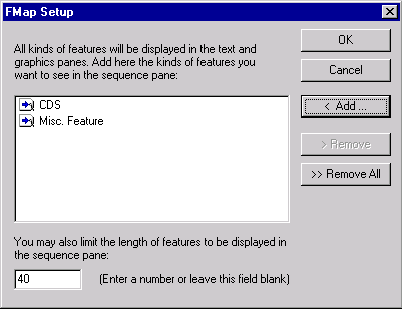
Press the FMap Setup button to indicate the types of features to be displayed in the Display windows sequence pane. (If the Feature Map check box is checked, Vector NTI will show all the features in the text and graphics panes.) The Feature Map Setup dialog box appears:
In this dialog box, you can choose the types of features that will be displayed in the sequence pane. Press the Add button to select one or more of available feature types. The Remove button allows one to remove previously selected feature types. Remove All empties the list.
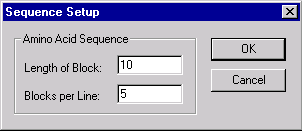
Sequence Setup
Press the Sequence Setup button to indicate how the sequence should be displayed in the Display windows sequence pane. The Sequence Setup dialog box appears:
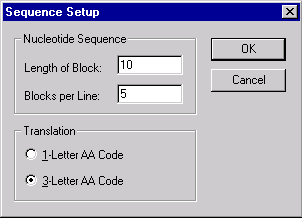
In this dialog box, you can set the number of nucleotides per block in the sequence display, the number of blocks per line and whether protein translations should be shown in one- or three-letter code.
+#Restriction Map~Setup options
"+#Restriction Map Setup
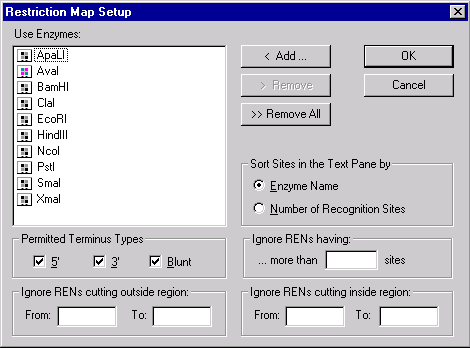
Press the RMap Setup button to indicate the restriction sites to be displayed in the Display window. The Restriction Map Setup dialog box appears. In this dialog box, you can choose restriction endonucleases and set conditions for displaying their sites in the Display window.
The list box contains an enzyme list to be used to build a restriction map. The Add button allows you to add database enzymes to this list by choosing one or more enzymes in a selected subbase of the databases enzyme table. The Remove button removes selected enzymes from the list. The Remove All button clears the list.
The four filter groups below the list are used to filter the resulting restriction map by hiding all enzyme sites that do not satisfy certain conditions.
The Permitted Terminus Types check boxes filters types of cutters to be displayed in the Display window.
If the Ignore RENs Cutting Outside region is specified, only those enzymes whose sites are located only inside the region will be displayed. If the Ignore RENs Cutting Inside region is specified, only those enzymes whose sites are located only outside the region will be displayed.
The Ignore RENs having more than sites group is a filter to remove from the restriction map RENs which cut too frequently. RENs that have more sites than the number in this field will be grayed out in the Restriction Map folder in the text pane and will not be displayed at all in the graphics and sequence panes. The Restriction Map folder in the text pane will, however, still contain all the RENs present in the selected list.
The buttons in the Sorted by area indicate how the restriction sites should be displayed in the text pane of the Display window. If you choose By Enzyme Name, the RENs will be listed alphabetically. If you choose By Number of Recognition Sites, the RENs will be listed by the number of occurrences of their sites on the molecule, from lowest to highest.
ORF Setup
Press the ORF Setup button to indicate which ORFs should be displayed in the Display window. The ORF Setup dialog box appears:
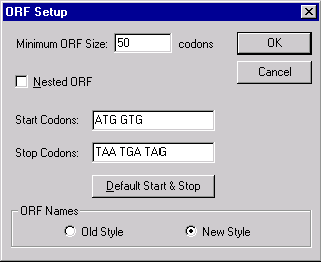
In this dialog box, you can indicate how open reading frames will be displayed in the Display window.
The Minimum ORF Size field allows you to set the minimum ORF size in codons.
Check the Nested ORF check box if you want Vector NTI to look for nested ORFs, which are ORFs that have the same stop codon but different start codons.
The Start and Stop Codons fields allow you to enter start and stop codons for the new Viewers ORFs. Pressing the Default Start & Stop button sets the start and stop codons to the following well-known values: Start codonsatg, gtg; Stop codonstaa, tga, tag.
Motifs Setup
Press the Motifs Setup button to indicate what motifs should be displayed in the Display window. The Motifs Setup dialog box appears.
The options in the dialog box allow you to specify what motifs and conditions should be used to form the motifs map in the Display window:
The list box in the upper part of the dialog box contains motifs already chosen for search. The Add New and Edit buttons allow you to add new motifs or edit a highlighted motif using the Oligo Editor dialog box. You also can remove selected motifs by pressing the Remove button or analyze a highlighted motif by pressing the Analyze button. The Oligo List button allows you to load oligos from Vector NTIs Oligo List, and the Oligo Database button allows you to use the Vector NTI oligo database as a source for motifs to be searched for. The Save To Database button allows you to save the selected motif to the oligo database.
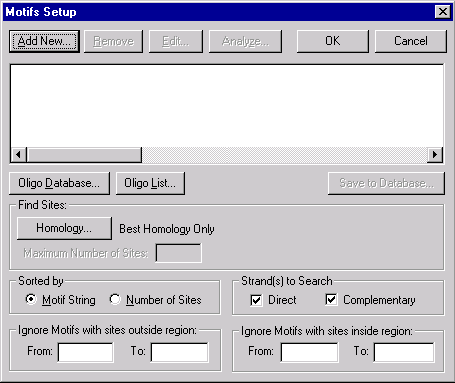
Find Sites
Press the Homology button to specify the homology between motif and molecule sequence for the motifs site to be accepted. Vector NTI displays the Find Motif Locations dialog box where you can chose the method used to calculate the homology and the homology requirements.
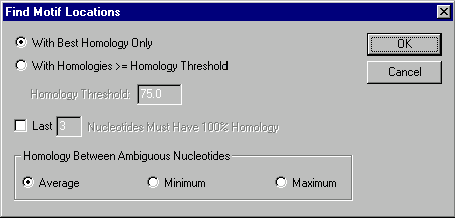
Choose the With Best Homology Only method to leave only those motif sites that received the best score. The With Homologies ³ Homology Threshold method allows you to display all motif sites that have homologies more or equal to the homology you specified in the Homology Threshold box. Regardless of the method you chose, you can also filter out all the motif sites which do not meet the specific requirement for 3 end homology by checking the appropriate box and entering the number of nucleotides on 3 end that should have 100% homology. The Homology Between Ambiguous Nucleotides section allows you to select a method of calculating homology between ambiguous nucleotides (if any). The Average, Minimum, and Maximum buttons indicate that the average, minimum, and maximum possible homology respectively will be calculated for any nucleotide pair. For instance, if you are calculating homology between N and A, then the average homology is 25%, the minimum homology is 0%, and the maximum homology is 100%. In case of R and A they are 50%, 0%, and 100%; in case of R and T0%, 0%, and 0%.
|
NN |
NR |
NA |
RW |
RA |
RT |
|
|
Maximum |
100 |
100 |
100 |
100 |
100 |
0 |
|
Average |
25 |
25 |
25 |
25 |
50 |
0 |
|
Minimum |
0 |
0 |
0 |
0 |
0 |
0 |
If you chose the Homology Threshold method, you can specify an additional limitation on the motifs shown in the restriction map. Any motifs which have more sites than specified in the Maximum Number Of Sites box will be displayed as grayed-out folders in the text pane and will not be displayed at all in graphics or sequence panes.
Strands to Search
Turn these boxes on or off to specify which strand(s) should be searched.
Ignore Outside / Ignore Inside
Enter these regions to specify additional limitations on the motif sites to be shown in the Display window. If the Ignore Motifs with sites outside region is specified, only those motifs that are located only inside the region will be displayed. If the Ignore Motifs with sites inside region region is specified, only those motifs which are located only outside the region will be displayed.
Sorted by
Select the sorting procedure to be used in the Motifs folder in the Display windows text pane. Choose the Motif String button to sort motifs alphabetically. Choose the Number of Recognition Sites button to sort motifs by their number of sites on the molecule. Motifs with fewer sites will be placed ahead of motifs with more sites.
Graphics Display Settings
The Display Setup settings also contain the Graphics Display Settings: the graphical styles, arrangement setup, and the assignment of the graphical styles to the graphical map element types. You can save and load these settings independently in the form of Vector NTI Molecule Setup Files, introduced in Vector NTI 5.0. To save current graphics map styles, press the Save To File button and enter a name for the new Molecule Setup file. To load graphics map styles from a Molecule Setup file, press the Load From File button and select the name of an existing file.
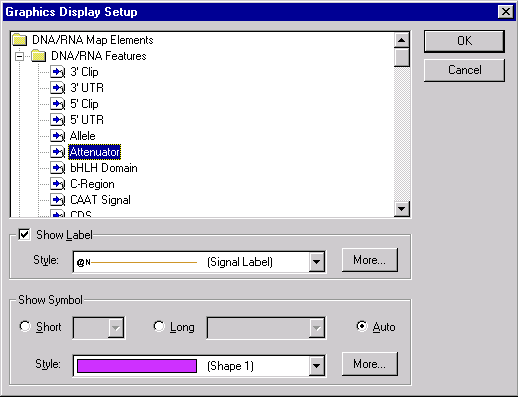
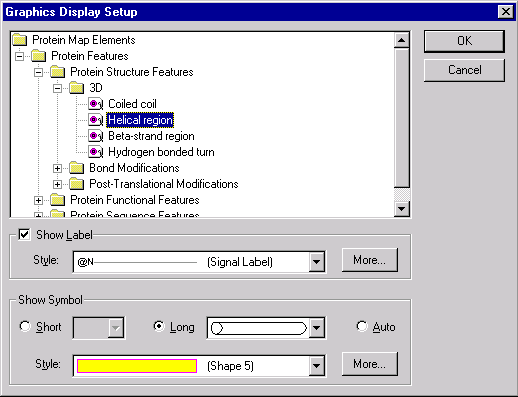
You can edit the assignment of the graphical styles to the graphical map elements directly from the Display Setup dialog. Press the Edit button in the Graphics Display Settings group. The Setup dialog box appears.
In this dialog you can select the graphical map element type and set the shape and style for a symbol picture as well as the style for a label attached to the symbol picture. You can add new styles by pressing More buttons (one button adds label styles, another adds symbol styles). You can edit existing styles directly in the graphics pane of a Molecule Display window as described later in this chapter.
Protein Molecule Display window setup
Feature Map Setup
Press the FMap Setup button to indicate what types of features should be displayed in the Display windows sequence pane (if the Feature Map check box is checked, Vector NTI always shows all features in text and graphics panes). The Feature Map Setup dialog box appears:
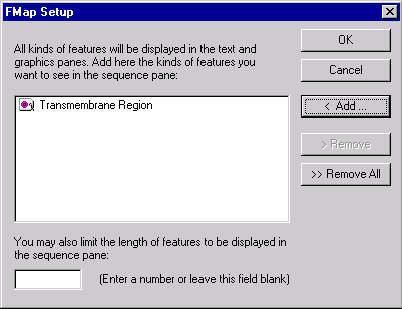
In this dialog box, you can choose the types of features that will be displayed in the sequence pane. Press the Add button to select one or more of available feature types. The Remove button allows one to remove previously selected feature types; Remove All empties the list.
Sequence Setup
Press the Sequence Setup button to indicate how the sequence should be displayed in the Display windows sequence pane. The Sequence Setup dialog box appears:
In this dialog box, you can set the number of amino acids per block in the sequence display and the number of blocks per line.
Picture Type
If the Prefer Constant Horizontal Resolution check box is checked, Vector NTI marks current setup as not scalable (for example, if you choose to look at a fragment of the protein, it would preserve the visual length of features instead of stretching the picture to fit in window). This also means that if you save this setup and later apply it to another protein molecule in a Display window, Vector NTI will keep the original horizontal resolution (number of amino acids per cm). Scalable setups are handled differently: Vector NTI recalculates the horizontal resolution in order to preserve the original horizontal size of the protein picture.
Graphics Map Styles
The Display Setup settings also contain the Graphics Map Style data: the graphical styles, arrangement setup, and the assignment of the graphical styles to the graphical map element types. You can save and load these settings independently in the form of Vector NTI Molecule Setup Files, introduced in Vector NTI 5.0. To save current graphics map styles, press the Save To File button and enter a name for the new Molecule Setup file. To load graphics map styles from a Molecule Setup file, press the Load From File button and select the name of an existing file.
You can edit the assignment of the graphical styles to the graphical map elements directly from the Display Setup dialog. Press the Edit button in the Graphics Display Settings group. The Setup dialog box appears:
In this dialog you can select the graphical map element type and set the shape and style for a symbol picture as well as the style for a label attached to the symbol picture. You can add new styles by pressing More buttons (one button adds label styles, another adds symbol styles). You can edit existing styles directly in the graphics pane of a Molecule Display window as described later in this chapter.
Saving the Display Setup settings in a
Setup Profile
The upper part of the Molecule Setup dialog contains a list of saved setup settings called Setup Profile. You can add the current settings to the list by pressing the Save Settings As button. Vector NTI asks for a name for these settings and saves them in the Setup Profile under the name you entered. The name will appear in the Setup Profile list and you will be able to recall the saved settings at any moment by selecting their name in this list or in the Display Profile menu (located in the Vector NTI workspaces View menu ). Vector NTI uses the Display Setup settings named (Default) each time you open a molecule in a new Molecule Display window. There are three exceptions to this rule: if the current active window is a Molecule Display window, Vector NTI uses the settings of an active window instead of the (Default) entry in the Setup Profile; if you open a molecule from the database, you can select the Display Setup for a new Display window by pressing the Display Setup button; and, finally, if you open a molecule from the database via a Molecule Shortcut file, the settings stored in the shortcut file are used instead of the (Default) entry in the Setup Profile.
Saving Molecules
Vector NTI allows for two kinds of permanent storage for molecules. You can store a molecule in the Vector NTIs database or you can store a molecule in a Vector NTI Molecule Document file. These two forms of storage have different purposes. Vector NTIs database supports parent-descendant connections between molecules, automatic tracking of modifications, search, and many other operations on the set of molecules as a whole. On the other hand, a Molecule Document is a convenient way to store a single molecule together with its graphical representation and analysis results as a self-contained unit suitable for "publishing", information exchange, etc. A Molecule Document for a constructed molecule does not contain the molecules parents and thus is not suitable to store related molecules in the same way as they are stored in the database.
New style of open/save dialogs
In previous versions we have had many separate open/save dialogs in order to work with the different molecule sources. Vector NTI will let you work with molecules stored as files and with molecules stored in the Vector NTI database. The new open/save dialogs now unite the access to different molecules in one tabbed dialog box as follows.
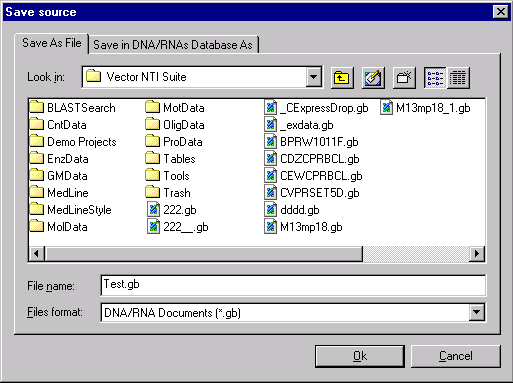
By utilizing this dialog box, you can choose to save your molecule as a specific file, or you can choose to save it within the Vector NTI database.
Saving a molecule to the database
To save a molecule displayed in a Molecule Display window to the Vector NTI database, choose the Save To Database or Save To Database As commands from the Molecule menu. The Save To Database command is useful to save the changes you made to a database molecule in the Display window, back to the database under the same name. The Save To Database As command can be used to save the Display window molecule in its current state to the database under a name you specify.
Creating a Molecule Shortcut file for a database molecule
Vector NTI allows you to create special Molecule Shortcut files which contain the name of a database molecule along with the Display Setup parameters. When you open a database molecule via the Shortcut file, Vector NTI will use the Display Setup parameters stored in the shortcut file.
To create a Shortcut file for a database molecule, open the molecule in a Display window, set the desired Display Setup parameters and choose the Create Shortcut command from the Molecule menu. Vector NTI will show the standard File Save dialog where you can choose the name and location of a new Shortcut file.
Saving a molecule to a Molecule Document file
You can save a molecule opened in a Molecule Display window to a Molecule Document file. Molecule Documents are useful if you want to save all the information contained in a Molecule Display window such as graphical representation and molecule analysis results as well as the molecule itself in a portable format suitable for information exchange. The Molecule Document format is based on GenBank/GenPept, so that not only Vector NTI but also any other program able to import GenBank/GenPept files could import Molecule Documents.
To save a molecule opened in a Molecule Display window to a Molecule Document file, choose the Save As Document command from the Molecule menu and chose the name and location of the Document file in the standard File Save dialog box. When you press the OK button (Windows) or the Save button (Macintosh), the active Display window is saved as the Molecule Document. If Vector NTI is configured for Internet publishing, you will see one more dialog asking your permission to create an HTML file for the molecule. This HTML file will contain a brief description of the molecule and a hypertext link to the Molecule Document file.
Exporting a molecule to a GenBank/GenPept, EMBL/SWISS-PROT or FASTA file
Vector NTI allows you to easily export a molecule opened in a Molecule Display window to GenBank/GenPept, EMBL/SWISS-PROT, or FASTA file. This is a convenience feature; to use Vector NTIs export capabilities in full you need to go to the Database Explorer, described in detail in Chapter 15.
To export a molecule opened in a Molecule Display window to an external file, choose the Export command from the Molecule menu and select type of the file and the name of the file from the file list in the standard File Save dialog.
Exporting a molecule sequence to a file
Vector NTI allows you to easily export the sequence of the molecule opened in a Molecule Display window to a sequence file. Make sure that the Display window of the molecule whose sequence you want to export is the active one, and choose the Export Sequence command from the Molecule menu. Vector NTI will show the standard File Save dialog where you can choose the name and location of a sequence file.
Printing from Display windows
Printing from Display windows is done one pane at a time. To print a pane, move the focus to that pane and then press the Print button ( ![]() ) on the main toolbar or choose the Print command from the File menu. A standard printing dialog box appears. Click OK (Windows) or Print (Macintosh) to print the active pane of the Display window.
) on the main toolbar or choose the Print command from the File menu. A standard printing dialog box appears. Click OK (Windows) or Print (Macintosh) to print the active pane of the Display window.
Page Setup
Vector NTI prints text and sequence panes in a standard format. For text and sequence, you can change the content of what is printed, but not the layout.
Graphical maps can be printed out at any size and in various positions on the page.
To change the size and position of a graphical maps printout, go to the File menu and choose Page Setup. A dialog box appears, in which you can set the margins for your printout.
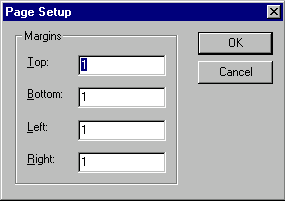
Set the margins to your desired values in inches and click OK.
By choosing the margins, you can obtain any desired scale and position of the graphical map on the page.
Print preview
To see a preview on your screen of what the printout will look like, choose the Print Preview command from the File menu.
Using the Camera to copy Display window graphical representation to the clipboard or to a file
You can copy graphical representation of Display windows panes to the Clipboard or to a file with Vector NTIs Camera feature. The Camera command is an alternative to the Print command; you can transfer the graphical representation of Display windows panes to your favorite word processor or electronic publishing program instead of making a hard copy on a printer. You need to use the Copy command from the Edit menu to transfer the actual sequence (instead of its graphical representation) between Vector NTI windows and other applications. You can also use a separate Camera tool on the Database Explorer windows as described in Chapter 15.
From the Clipboard, you can paste the copied text or picture into your other running applications. The Clipboard stores Vector NTI text and nucleotide sequence graphical representations as plain or formatted (RTF) text, and it stores Vector NTI graphics as Windows Metafile (Windows) or PICT (Macintosh).
First, you must select the part of a pane you wish to copy (if nothing is selected, Vector NTI will copy the entire pane). To select text in a Display windows text pane, click on the line you wish to select. To select multiple lines in a sequence or text pane, press the mouse button and drag across the lines you wish to select. To select in a Display windows graphics pane, choose the Edit Picture command in the graphics panes View command to enter the Picture Editing mode and click on any object to select it. To select more than one object, click on each object in turn while holding down the shift key.
You can select an entire pane by making that pane the active pane and choosing the Select All command from the Edit menu. Note, that you can always choose to copy the entire pane in the Camera dialog box, displayed by the Camera command.
In a Display windows text pane, you can select a folder and all its subfolders by placing the focus on the folder and choosing the Select Branch command from the Edit menu.
Once your information is selected, press the Camera button ( ![]() ) on the main toolbar or choose the Camera option from the Edit menu. The Camera dialog box will appear:
) on the main toolbar or choose the Camera option from the Edit menu. The Camera dialog box will appear:
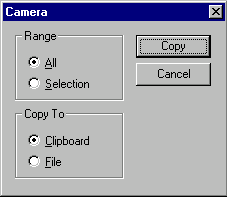
In this dialog box, you have the following options:
Range
Specify the range of the data to be copied. Selection option is unavailable if no selection is defined in the active pane.
Copy To
Specify the destination of the copy operation. If you select the File option, Vector NTI displays the Copy To dialog box so you can specify the name and format of the output file. Copying data to the Clipboard replaces any existing Clipboard contents.
The information is sent to the Clipboard or to a file as text or graphics. For text information, character formatting is preserved (font, face, size), but other formatting is lost. The Camera converts graphics information to Windows Metafile format (Windows) or PICT format (Macintosh).
Working With Display windows
The following sections describe in detail how to use the text, graphics, and sequence panes of Vector NTI Display windows.
The text pane
The text pane of a Vector NTI Molecule Display window contains a thorough description of the molecule, including common database information, feature map, and results of analyses as well as molecule type-specific information such as restriction maps, ORFs, motifs for DNA/RNA molecules. The content of the text pane depends on a specific Display Setup.
The text pane can be used for studying information about the molecule. In addition, when linked to a graphics and sequence pane the text pane controls the information that is displayed.
Changing the size of the text pane
You can change the size of the text pane by dragging the split bar that divides the Display windows panes.
Scrolling the text pane
You can scroll the text pane left, right, up, and down with its scroll bars. If the active pane is the text pane, you can also scroll the pane with the arrow keys on the keyboard.
Folders
The text pane is divided into a hierarchy of folders and subfolders. A folder and its subfolders are called a branch. Display windows can contain the following folders:
|
Folder |
Contents |
|
General Description |
Molecule name, length, notes, etc. |
|
Describes the fragments from which the molecule is constructed |
|
|
Design plan determined by Vector NTIs built-in biological knowledge |
|
|
Feature map of the molecule |
|
|
Restriction map of the molecule |
|
|
Open Reading Frames (DNA/RNA) |
|
|
Motifs (DNA/RNA) |
Motifs found on the molecule |
|
Results of PCR analysis |
|
|
Results of sequencing primer search |
|
|
Results of hybridization probes analysis |
|
|
Results of common Protein analyses |
|
|
Text annotations added by the user |
Opening and closing folders
To open or close a folder, click the small square (Windows) or triangle (Macintosh) located to the left of it. If the folder was closed, it will open. If it was open, it will close. You can also select folder line and use the Toggle Folder command from the View menu or press enter (Windows) or return (Macintosh).
When you open or close a folder, the subfolders do not change state.
Expanding and collapsing folders
Opening a folder simultaneously with some or all of its subfolders is called expanding that folder.
Closing a folder simultaneously with some or all of its subfolders is called collapsing that folder.
The View menu has commands for expanding and collapsing folders and subfolders in various combinations:
|
Command |
Result |
|
Expand One Level |
Opens the focused folder; makes sure all subfolders are closed |
|
Expand Branch |
Opens the focused folder and all of its subfolders |
|
Expand All |
Opens every folder and subfolder in the text pane |
|
Collapse Branch |
Closes the focused folder and all of its subfolders |
|
Collapse All |
Closes every folder and subfolder in the text pane |
|
Collapse Around |
Closes all folders and subfolders, except any highlighted folders and their parents |
Deleting annotations
To delete an annotation, click the subfolder representing that annotation in the text pane to select its line, and press the Delete Annotation button ( ![]() ) in the Window toolbar or choose the Delete Annotation command from the Edit menu.
) in the Window toolbar or choose the Delete Annotation command from the Edit menu.
Annotations can also be deleted from the graphics pane by selecting them in the Picture Editing mode and choosing the Delete Annotation command from the Edit menu.
Annotation subfolders are the only folders of the text pane that can be deleted.
Finding objects on graphics and sequence panes
Some objects, described in the text pane, are also displayed in the graphics and sequence panes. To find the position of the object, select its line in the text pane and press the Find button ( ![]() ) in the window toolbar, select the Find command from the Edit menu or press ctrl+f (Windows) or command+f (Macintosh). The object will be selected on the sequence and graphics panes. The Find command is disabled if the selected line does not describe the object, displayed in two other panes. Note, that Vector NTI allows you to find only single objects like a restriction site, not multiple objects like all restriction sites for a certain REN.
) in the window toolbar, select the Find command from the Edit menu or press ctrl+f (Windows) or command+f (Macintosh). The object will be selected on the sequence and graphics panes. The Find command is disabled if the selected line does not describe the object, displayed in two other panes. Note, that Vector NTI allows you to find only single objects like a restriction site, not multiple objects like all restriction sites for a certain REN.
The graphics pane
The Molecule Display windows graphics pane provides a graphical display of the molecule, which includes feature map and user annotations for proteins and feature and restriction maps, ORFs, motifs, component fragments, design description, and user annotations for DNA/RNA molecules.
Vector NTIs graphical displays consist of graphics objects. These are of two types: symbols, such as arrows representing features, a ring or line representing a molecules DNA/protein sequence, and labels. Labels are often associated with particular symbols and are connected to them by droplines.
Molecule Editing mode and Picture Editing mode
Vector NTI has two modes of operation in graphics panes. The first (and default) mode is the Molecule Editing mode. In this mode the graphics pane serves as a visual environment for viewing and editing graphical maps and sequence of a molecule as well as selecting DNA molecule fragments for construction and design.
The other mode is the Picture Editing mode that allows you to edit the graphical representation of a molecule, i.e., format and arrange the individual graphics objects. This mode is useful for preparing publication-quality figures of the molecule. However, please note that all operations on the graphical representation of the molecule do not affect the actual data of the molecule opened in the Display window.
You can toggle between modes by clicking the Edit Picture ( ![]() ) button on the Window toolbar, or by choosing the equivalent command in the View menu. When the graphics pane is in the Picture Editing mode, the button is shown in depressed state and Edit Picture menu item in the View menu is checked.
) button on the Window toolbar, or by choosing the equivalent command in the View menu. When the graphics pane is in the Picture Editing mode, the button is shown in depressed state and Edit Picture menu item in the View menu is checked.
Circular and linear displays
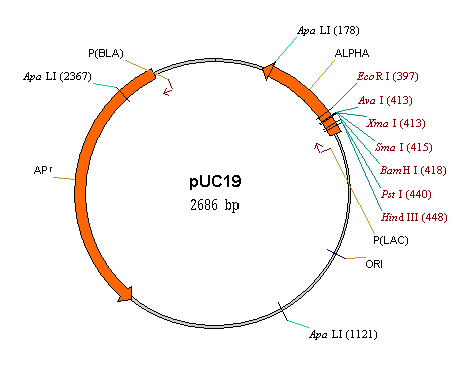
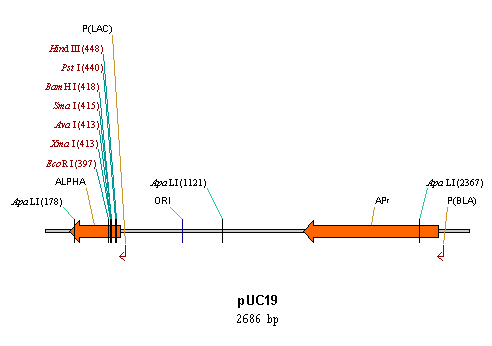
Circular DNA molecules can be displayed in either circular or linear form. Linear DNA/RNA molecules and proteins can only be viewed in linear form.
Choose circular or linear display format for a circular DNA molecule with the Linear Display and Circular Display buttons on the Window toolbar of the graphics pane or with the equivalent commands in the View menu.
Zooming the graphical map in and out
The graphical map in a Display windows graphics pane can be zoomed in or out, or fit to the current pane size to suit your needs.
To zoom in on a graphical map (enlarge it) by 150%, click the Zoom In button ( ![]() ) on the Window toolbar of the graphics pane or choose the Zoom In command from the View menu. To zoom in by a small increment, hold down the shift key and click the Zoom In button. You may also use keyboard shortcuts ] and shift+].
) on the Window toolbar of the graphics pane or choose the Zoom In command from the View menu. To zoom in by a small increment, hold down the shift key and click the Zoom In button. You may also use keyboard shortcuts ] and shift+].
To zoom out from a graphical map (reduce it) by 50%, click the Zoom Out button ( ![]() ) on the Window toolbar or choose the Zoom Out command from the View menu. To zoom out by a small increment, hold down the shift key and click the Zoom Out button. You may also use keyboard shortcuts [ and shift+[.
) on the Window toolbar or choose the Zoom Out command from the View menu. To zoom out by a small increment, hold down the shift key and click the Zoom Out button. You may also use keyboard shortcuts [ and shift+[.
If the current display is linear, you can change the horizontal zoom factor only by holding down the ctrl key (Windows) or command key (Macintosh) and clicking on Zoom In or Zoom Out button. Changing only horizontal zoom factor changes the internal aspect ratio of the graphical display; this ratio is saved when you save Display Setup and can be applied to other Display windows as well.
To fit a graphical map to the current size of the graphics pane, click the Fit to Window button ( ![]() ) on the Window toolbar or choose the equivalent command in the View menu. The keyboard shortcut for this command is =.
) on the Window toolbar or choose the equivalent command in the View menu. The keyboard shortcut for this command is =.
Scrolling the graphics pane
You can scroll the graphics pane left, right, up, and down with its scroll bars.
Standard Arrangement
Vector NTI has a standard method for arranging objects in the graphics pane. This Standard Arrangement sets all symbols to standard sizes, sets labels to a standard font size, and arranges text to prevent or minimize overlap.
Each Display window has its own Standard Arrangement; Standard Arrangement parameters are a part of a general Display Setup.
When a Display window is first created, it appears in its Standard Arrangement according to the current Display Setup.
You can return a graphics pane to its Standard Arrangement by pressing the Standard Arrangement button ( ![]() ) on the graphics panes Window toolbar or choosing the Standard Arrangement command from the View menu.
) on the graphics panes Window toolbar or choosing the Standard Arrangement command from the View menu.
When you command a change to Standard Arrangement, certain changes you have made to the layout in the Picture Editing mode will be lost. Object attributes (colors, patterns, and font) as well as relative symbol sizes will not be affected (but object locations will); hidden objects will remain hidden; other formatting changes will remain in effect and the way in which objects overlap will not be affected.
Setting up the Standard Arrangement
You can change the sizes of symbols and labels that the Standard Arrangement will use. If the current display is linear you can also change the way labels are spread horizontally. To change the sizes of the Standard Arrangement, press the Standard Arrangement button ( ![]() ) on the Viewer toolbar together with the ctrl key (Windows) or command key (Macintosh) The Arrangement Setup Palette appears:
) on the Viewer toolbar together with the ctrl key (Windows) or command key (Macintosh) The Arrangement Setup Palette appears:
This palette allows you to change standard sizes and layout of graphics objects in the active graphics pane. There are two types of graphics objects: symbols, such as arrows representing functional signals, and labels. Vector NTI redraws the graphics pane to display changes each time you press a button in this palette.
The Arrangement Setup Palette has three sets of buttons, one for controlling symbols and the other two for controlling labels.
The Stretch Symbols ( ![]() ) and Shrink Symbols (
) and Shrink Symbols ( ![]() ) buttons respectively increase and decrease the standard thickness of symbols by ~15%. You can hold down the shift key while pressing a button to change thickness in small increments.
) buttons respectively increase and decrease the standard thickness of symbols by ~15%. You can hold down the shift key while pressing a button to change thickness in small increments.
The Stretch Labels ( ![]() ) and Shrink Labels (
) and Shrink Labels ( ![]() ) buttons respectively increase and decrease the standard size of labels by ~15%. You can hold down the shift key while pressing a button to change size in small increments.
) buttons respectively increase and decrease the standard size of labels by ~15%. You can hold down the shift key while pressing a button to change size in small increments.
The Spread Labels ( ![]() ) and Condense Labels (
) and Condense Labels ( ![]() ) buttons respectively spread out and compress labels on the linear layout. You can hold down the shift key while pressing a button to move labels in small increments.
) buttons respectively spread out and compress labels on the linear layout. You can hold down the shift key while pressing a button to move labels in small increments.
Press the Standard Arrangement button again to close the palette.
Changing the settings for graphics pane
Vector NTI uses common settings to describe what needs to be displayed in all three panes. You can change this settings by choosing the Display Setup command from the Edit menu or press the Display Setup button ( ![]() ) in the Window toolbar and choosing the Display Setup command from the popup menu. A Molecule Display Setup dialog will appear. The Feature Map and other sections of the dialog described previously in this chapter allow you to choose what elements will be displayed in the Display window. The Picture Type section is graphics pane-specific. For DNA/RNA Display windows, it allows you to specify that you prefer linear display maps for circular molecules by checking the Prefer Linear box. In the case of Protein/RNA Display windows, it allows you to specify that you prefer to view the picture of the molecule at constant horizontal resolution (for example, if you choose to look at a fragment of the protein, it would preserve the visual length of features instead of stretching the picture to fit in window). The Graphics Display Settings section is also graphics pane-specific. You can change the way graphics map elements (i.e. features) are displayed on the graphical map as well as save/load graphical map styles. These options are described in detail in the Formatting objects on the graphical map section below.
) in the Window toolbar and choosing the Display Setup command from the popup menu. A Molecule Display Setup dialog will appear. The Feature Map and other sections of the dialog described previously in this chapter allow you to choose what elements will be displayed in the Display window. The Picture Type section is graphics pane-specific. For DNA/RNA Display windows, it allows you to specify that you prefer linear display maps for circular molecules by checking the Prefer Linear box. In the case of Protein/RNA Display windows, it allows you to specify that you prefer to view the picture of the molecule at constant horizontal resolution (for example, if you choose to look at a fragment of the protein, it would preserve the visual length of features instead of stretching the picture to fit in window). The Graphics Display Settings section is also graphics pane-specific. You can change the way graphics map elements (i.e. features) are displayed on the graphical map as well as save/load graphical map styles. These options are described in detail in the Formatting objects on the graphical map section below.
Multi component features
A Multi Component feature is a feature that for instance, contains an intron and exon. Vector NTI can work with these features, and place them graphically on a molecule. An ordinary feature is shown as a wide arrow on the graphics pane. The direction of this arrow depends on which strand the feature is located. The coding sequences, or exons, are shown as filled parts of the arrow, while the intervening sequences, or introns, are shown as a gap within the arrow.
Additional operations with multi components features
The additional operations that affect the graphic pane include:
To select exons - Hold the SPACE key down and click the left mouse button on the exon.
Translate with components direct/complement - Select this item from the context popup feature menu. Vector NTI will then translate only the exon DNA/RNA to protein and show the translation on the Sequence pane (direct or complementary strand, depending on the feature location).
Molecule Editing mode: Editing graphical maps and sequence
Molecule Editing mode is used for viewing and editing graphical maps of a molecule, viewing ORFs and motifs (for DNA molecules), and editing molecules sequence. This mode is also used to select DNA molecule fragments for construction and design.
Selecting signals and sites on the graphical map
In Molecule Editing mode, you can select elements of the functional and restriction maps, ORFs and motifs and perform various operations on them. Vector NTI also shows the selected region on the molecule using selection wireframe. The selected part of a sequence is also highlighted in the sequence pane and its coordinates are shown in the selection box on the status bar. The current position on the molecule is displayed by the caret on both graphics and sequence panes and shown in the caret position box in the status bar. When a selection is defined, the caret is placed on either 3 or 5 end (a or c end for proteins) of the selection wireframe. If the caret position is displayed with (3/5,a/c) string in the caret position box, the caret is attached to the corresponding end of the selection.
To select an element of the graphics map, move the mouse cursor to the appropriate symbol or label, connected with the symbol. When the cursor points to the restriction site or motif site, Vector NTI turns the cursor to crosshair with a word site (Windows) or letter s (Macintosh) near it (![]() ). If you leave the cursor on the site for a few seconds, a message will be displayed near the cursor position telling you the type and position of the site. You may click on the site or site label to select it. The site and site label are highlighted and the caret is placed on the site position in both graphics and sequence pane.
). If you leave the cursor on the site for a few seconds, a message will be displayed near the cursor position telling you the type and position of the site. You may click on the site or site label to select it. The site and site label are highlighted and the caret is placed on the site position in both graphics and sequence pane.
To select a feature or ORF, move the cursor to the features symbol or label. Vector NTI turns the cursor to a hand (![]() ) and, few seconds later, displays a message telling you the type, name, and location of the feature or ORF. You may click on the symbol or its label to select it. The feature or ORF is highlighted and the correspondent region of the molecule is selected in both graphics and sequence pane.
) and, few seconds later, displays a message telling you the type, name, and location of the feature or ORF. You may click on the symbol or its label to select it. The feature or ORF is highlighted and the correspondent region of the molecule is selected in both graphics and sequence pane.
Selecting molecule regions on the graphical map
To select a region of the molecule other than feature or ORF you may choose the Set Selection command from the Edit menu. The Set Selection dialog will appear where you can enter the coordinates of the region to be selected. The coordinates start from 1. Both start and end nucleotides are included in the selection, so to select the nucleotides or amino acids 5 and 6 you should enter From: 5, To: 6. Press the OK button and the region you entered will be selected with a wireframe on a graphics pane and with highlighting on a sequence pane. The coordinates of the current selection are shown in the selection box on the status bar. You can invoke the Set Selection dialog by clicking on this box or pressing ctrl+g (Windows) or command+g (Macintosh).
When selection already exists, you can adjust its 5 and 3 (a and c) ends with the mouse. Move the mouse cursor to the 5 end of the selection wireframe. When the cursor changes its shape to the cross-hair with the 5 mark ( ![]() ), press the mouse button and drag the 5 end to the desired position (look at the selection box while you dragging). You can drag the 3 end of the selection in the same way.
), press the mouse button and drag the 5 end to the desired position (look at the selection box while you dragging). You can drag the 3 end of the selection in the same way.
Note that Vector NTI places the caret at the end of selection you are dragging. You can also use the home and end keys to move caret between 5/a (home) and 3/c (end) ends of the selection. The end of the selection marked with the caret can be moved with arrow keys on the keyboard. Press and hold the shift key and use left and right arrow keys to move the active end of selection one nucleotide/amino acid at a time. To move the caret faster you can also hold down the control key (do not release the shift key) with arrow keys. When the control key is down, Vector NTI moves the caret ten nucleotides/amino acids at a time.
To start a new selection you have to click anywhere in the blank area inside the molecule near one end of the desired region and drag the wireframe towards the other end. When the selection approaches the end of the region, release the mouse button. Now you can use the technique described above to adjust the 5/a and 3/c ends of the selection.
You can also shift-click anywhere in the blank area inside the molecule to move the active end of the selection. The general rule is that the shift key should be held down to adjust the existing selection (do not press it if you want to start a new one); the control key should be held down to move the caret in larger increments with arrow keys on the keyboard.
Notice that the selected fragment is also displayed with highlighting on the sequence pane. Vector NTI always displays selection in both panes no matter what pane you used to make it.
Selection techniques for choosing DNA fragments for recombination
The selection mechanism is also used to select parts of the DNA molecule for recombination. This usually requires selection of multiple functional signals and setting one or both ends of the selection to the restriction sites.
To select more than one functional signal, click on the first one and then hold down the shift key while clicking on other signals. The wireframe will include all selected signals. Since on a circular molecule there can be more than one way to choose a region including all selected signals, Vector NTI allows you to go through all possible cases. Pressing the tab key will move the selection ends to the next gap between selected functional signals; pressing shift+tab will move the selection ends to the previous gap between selected functional signals. The next gap is clockwise of the current gap, and the previous gap is counterclockwise.
To set a 3 or 5 end of the selection to a restriction site, press home or end to move the caret to the desired end of the selection and hold down the shift key while clicking on the label of the restriction site.
If an end of the selection zone is set to a restriction site, an @ symbol appears in front of that ends coordinate in the status bar.
Setting the caret position on the graphical map
To set the caret to a position of the molecule other than REN or motif site, you may choose the Set Caret Position command from the Edit menu. The Set Caret Position dialog will appear where you can enter the coordinate of the nucleotide/amino acid following the caret. The coordinates start from 1; so to set the caret before the first nucleotide of the molecule you should enter 1. Press the OK button and the caret will be placed to the position you entered. Note, that if a selection was defined before you called the Set Caret Position dialog, the end of the selection will be moved with the caret. The position of the caret is shown in the caret position box on the status bar. The Set Selection dialog can be called by clicking on this box.
You can also click anywhere in the blank area inside the molecule near the desired caret position and then adjust the position using keyboard commands as described in the previous section. Press and hold down the shift key if you want the end of the existing selection to follow the caret.
Editing the graphical map
The elements of the graphical map can be divided into two categories. One consists of the items explicitly described in the molecule data (features on DNA/RNA and protein molecules and restriction sites on unsequenced regions of a DNA molecule). The other includes all items calculated automatically from the DNA molecules nucleotide sequence (ORFs, motifs, and restriction sites on sequenced regions of the molecule). Vector NTI allows you to modify only the items from the first category. The automatic elements of the graphics map are not stored; they are calculated when the molecule is displayed and recalculated each time the molecule sequence or Display Setup are changed.
To delete an element from the graphical map, you have to select the element and choose the Delete command from the Edit menu. The name of the Delete command is changed to include the name of the object to be deleted. Alternatively, you can select the Delete command from the shortcut menu or press the delete key on the keyboard. To remove automatic objects from the graphics map you have to change the parameters in the Display Setup.
To edit an element of the graphics map, double-click on it or select it and choose the Properties command from the Edit menu. Alternatively, you can select the Properties command from the shortcut menu or press alt+enter (Windows) or command+i (Macintosh). The name of the Properties command is changed to include the name of the edited object. Vector NTI displays the dialog box where you can see and edit the properties of the selected object. The Properties dialogs for automatic objects do not contain editable fields.
You can easily add new features to a DNA/RNA or protein molecule and restriction sites to unsequenced regions of a DNA molecule. To add a feature, select the corresponding region of the molecule and choose the New4 Add Feature To FMap command from the Edit menu. Vector NTI displays the Molecule Feature dialog box where you can describe the feature.
ORFs can be added to the DNA molecules feature map in a similar way. Select the ORF you want to add and choose the New4 Add ORF to FMap command from the Edit menu. The Molecule Feature dialog box is displayed where you can name the feature (all fields are initialized with the information taken from the selected ORF).
Vector NTI allows you to add restriction sites to unsequenced regions of a DNA molecule. You can move the caret to the desired position and choose the New4 Add REN Site to RMap command from the Edit menu. Vector NTI shows the Restriction Sites dialog and fills the Site Positions field with the current caret position. You can enter more than one site position separated by space. Select the name of the enzyme and press the OK button. Vector NTI will add the sites modifying the nucleotide sequence accordingly.
Editing the sequence from the graphics pane
Change character display attributes
You can change character display attributes in the sequence pane in a fashion similar to a word processor program. You can change the font name, font size, font color and font attributes (bold, italic, underline) for any character in a nucleotide sequence.
To change the attributes of a character or characters, highlight these characters and click the corresponding buttons on the toolbar.
|
Button |
Description |
|
|
Set or clear bold character(s) attribute |
|
|
Set or clear italic character(s) attribute |
|
|
Set or clear underline character(s) attribute |
|
|
Select font name for character(s) |
|
(Font size combobox) |
Select font size for character(s) |
|
|
Select font color for character(s) |
For quick access to the font attribute tool you can use these shortcuts on the keyboard:
|
Shortcut |
Description |
|
ctrl-b |
Set or clear bold character(s) attribute |
|
ctrl-i |
Set or clear italic character(s) attribute |
|
ctrl-u |
Set or clear underline character(s) attribute |
Note: Sequence formatting does not serve any purpose other than tailoring the printout to meet your needs. To preserve formatting (also all of the other settings) between sessions, the Vector NTI molecule should be saved as a molecule document.
Vector NTI implements several operations allowing you to edit the nucleotide or amino acid sequence of a molecule. Three of them make use of the standard Clipboard (Cut, Copy, and Paste); others allow you to insert literal fragments or modify existing fragments.
To Cut, Copy, or Delete a region of the molecules sequence you need to select it first using the technique described above and then choose the appropriate command from the Edit menu. If deleted region overlaps with features, Vector NTI will show a confirmation dialog allowing you to keep or remove affected features. All the features inside the deleted region will be removed without confirmation; positions of other features will be adjusted accordingly.
Vector NTI puts the copied sequence on the Clipboard in the standard text format, so you can freely exchange the sequence data between Vector NTI and other applications. All sequence formats recognized by Vector NTI can be pasted from the Clipboard. The sequence formats are described in detail in Chapter 15 (Import section).
To Paste a sequence from the clipboard you have to cancel the current selection if any and set the caret to the position where you want the new sequence fragment to be inserted. Then, choose the Paste Sequence command from the Edit menu. Vector NTI reads the sequence from the clipboard and displays this sequence in the Insert Sequence dialog box. Press the OK button and the sequence will be inserted at the caret position. If the insertion point is within a feature, Vector NTI will show a confirmation dialog allowing you to keep or remove the affected features. The positions of all features surrounding the insertion point will be updated automatically.
You can insert a new sequence fragment manually by setting the caret to the desired insertion position and choosing the New4 Insert Sequence command from the Edit menu. Vector NTI displays the Insert Sequence dialog box where you can enter the sequence you want to insert.
Picture Editing Mode: Formatting and annotating
pictures
Picture Editing mode is used to edit the graphical representation of the molecules feature and restriction maps. This mode is useful for preparing publication-quality figures of the molecule. When in Picture Editing mode, Vector NTI changes the way it selects objects in the graphics pane: the elementary units of selection are graphics objects like labels and arrows, not elements of the feature or restriction maps. In this mode, you can reposition and reformat labels and symbols. You can hide objects to prevent them from being displayed, and you can format multiple objects at once using centralized style sheets. All the operations on the graphical representation do not change the molecule itself.
Undo and Redo
Vector NTI keeps track of changes you make to the graphical representation of a molecules graphics map and allows you to undo and redo those changes. You can undo/redo movement and formatting of graphics objects, redefinition of styles, etc. Undo/Redo also works in the sequence pane. The list of actions, tracked by undo/redo as well as the size of undo buffer can be changed in the Undo/Redo tab of the Options dialog, accessible from the Edit menu.
To undo an action, press the Undo button ( ![]() ) in the main toolbar or choose the Undo command from the Edit menu.
) in the main toolbar or choose the Undo command from the Edit menu.
To redo an action, press the Redo button ( ![]() ) in the main toolbar or choose the Redo command from the Edit menu.
) in the main toolbar or choose the Redo command from the Edit menu.
Moving objects on the graphical map
To move a graphics object around the graphics pane, click on the symbol or label to be moved, to select it. Put the cursor in the middle of the selected object. When the cursor turns to a thick four-pointed cross, the graphics object is ready to be moved. Press and hold the mouse button, and drag the object to the new location.
Labels will move freely around the graphics pane as you drag, with their droplines tracking the connection to the object to which they refer.
Most symbols representing features, restriction sites, etc., will not move completely freely around the graphical map. They will move freely perpendicular to the sequence bar/ring, but Vector NTI will prevent them from moving parallel to the sequence bar without your permission. This is to keep the objects in the places corresponding to their actual locations in the nucleotide or amino acid sequence.
To move a symbol parallel to the sequence bar of a graphical map, press and hold ctrl+shift (Windows) or option+shift (Macintosh) and drag the object. Note, that this will not change the coordinates of the feature in the feature map. To change the coordinates (and the picture) you need to edit the feature in the Molecule Editing mode as described earlier.
Changing the sizes and shapes of symbols.
You can change the size and shape of symbols.
To change the size or shape of a symbol, select the object to be changed by clicking on it with the mouse. Black drag boxes will appear at its corners. Put the cursor on any appropriate drag box so that the cursor turns to a thin four-pointed cross. Now press and hold the mouse button, and drag the black box. As you drag, the symbol changes shape and/or size. Release the mouse when the symbol has the new shape you want.
Simply moving the drag boxes changes the size and shape in such a way that the coordinates do not change. If you want to change the symbol in a way that will change its coordinates on the sequence, press ctrl+shift (Windows) or option+shift (Macintosh) and drag.
Changing the display order of overlapping graphics objects
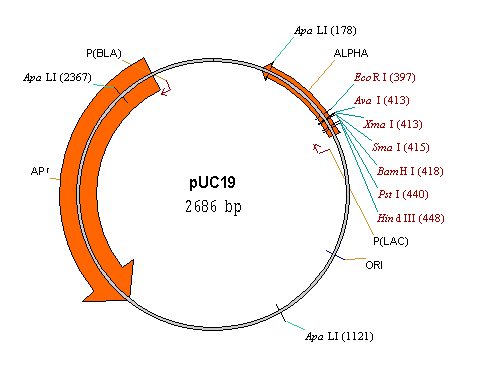
You can change the display order of overlapping graphics objects. Select graphics objects whose display order you wish to change, and then choose the Picture Element4 Bring To Front or Picture Element4 Send To Back command from the View menu. Alternatively, you can press the right mouse button (Windows) or hold down the command key and press the mouse button (Macintosh) with the cursor pointing at one of the selected objects and choose the Bring To Front or Send To Back command from the shortcut menu.
Bring to Front means the selected objects will be displayed on top of all other objects that occupy the same space. Send to Back means the selected objects will be displayed behind all objects that occupy the same space.
The following picture demonstrates the results of bringing the DNA ring to the front of a circular molecule display:
Hiding graphics objects
Graphics objects in the graphics pane can be hidden. This is useful if you dont want them to appear on a final picture or if you want to have more room for better layout of important picture elements. To hide an object or objects, select them and then choose the Hide command from the Edit menu. The objects disappear. If you hide symbols, their labels will remain visible unless you hide them specifically.
Restoring hidden graphics objects
To restore hidden graphics objects to the graphics panes display, put the Windows focus in the text pane, link the text and graphics panes, and open the folder(s) containing the hidden graphics objects. You can also undo the Hide command using the Undo command from the Edit menu.
Formatting objects on the graphical map
You can format objects on the graphical map in a variety of ways, depending on their type. For symbols, you can change the shape, the fill pattern and color, and the color of the line around the object. For labels, you can change the font (size, style and color) and the color of the dropline connecting the labels to a symbol, if a dropline is present.
To format an object in the graphics pane, select the object by putting the mouse cursor on it and clicking. If you wish to format more than one graphics object at a time, select them all by shift-clicking on them in turn.
When the graphics objects you want to format are selected, choose the Properties command from the Edit menu or press alt+enter (Windows) or command+i (Macintosh). If you want to format a single object, you can double-click on it. Vector NTI displays the Properties dialog with several tabs or pages, one for each attribute.
In the Properties dialog, you may choose to change an objects Line, Fill, or Text attributes. If you have selected a single symbol, you may also change its Shape attribute.
Line
When you select the Line tab, the Line property page appears:
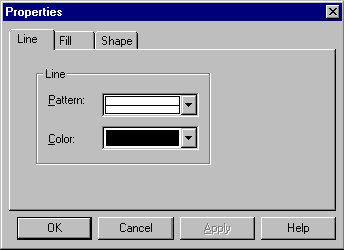
On this page, boxes allow you to choose the pattern and color of lines associated with the graphics objects you are formatting.
Lines associated with symbols are the lines that surround the main symbol. Lines associated with labels are the droplines connecting the labels to its corresponding symbol.
Fill
When you select the Fill tab, the Fill property page appears.
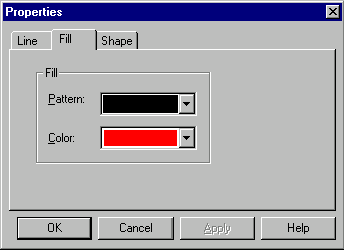
On this page, boxes allow you to choose the pattern and color with which the symbols you selected are to be filled.
Changing a symbols filling does not affect the formatting of the line around that symbol.
Shape
When you select the Shape tab, the Shape property page appears.
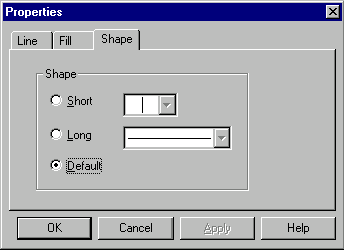
On this page, boxes allow you to choose the shape of the selected symbol.
Choosing the Default option forces Vector NTI to assign the default shape to the given symbol based on the type of the corresponding graphics map element (a feature type, for example). You can edit the association between the element type and the default shape/style in the Graphics Display Setup dialog accessible from the Display setup dialog.
Please note, that you cannot undo the shape formatting.
Text
When you select the Text tab, the Text property page appears.
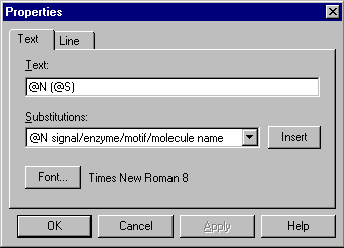
On this page, a box allows you to enter the text you would like the label to contain. You can enter ordinary text plus a variety of special codes which will be converted into information about the symbol to which the label is attached. For example, its name and nucleotide coordinate. To insert a substitution code, choose the code from the Substitutions box and press the Insert button. The code will be inserted at the current caret position.
This substitution model allows assignment of a single text style to all labels of a certain kind. For example, if the text attribute for all restriction sites is @N (@S) then the actual label for a SmaI site 5354 bp will look like SmaI (5354) with the REN name and site position substituted for @N and @S.
The Font button on this page allows you to choose the font, font style, font size, effects, and display color attributes of labels you selected. Currently selected font is displayed to the right of the Font button. Note, that the font size you choose in the Font dialog will not necessarily be equal to the font size used on the screen or printed output. All the display objects are stretched and shrunk as the picture magnification is changed.
Annotations
Vector NTIs Picture Editing mode allows you to insert your own text annotation labels in a graphical map. To insert a text annotation, press the Annotation button ( ![]() ) in the Window toolbar or choose the New4
Add Annotation command from the Edit menu. The Annotation dialog box appears, where you can enter the text of a new annotation label.
) in the Window toolbar or choose the New4
Add Annotation command from the Edit menu. The Annotation dialog box appears, where you can enter the text of a new annotation label.
You can move annotations, change their font and formatting using the label formatting techniques described above.
To delete an annotation, select it in the graphics pane and choose the Delete Annotation command from the Edit menu. To delete an annotation in the text pane, click on the subfolder representing that annotation to select its line, and press the Delete Annotation button ( ![]() ) in the Window toolbar or choose the Delete Annotation command from the Edit menu.
) in the Window toolbar or choose the Delete Annotation command from the Edit menu.
Please note, that annotations are elements of the graphical representation of the molecule only. Annotations are not stored in the database. To save an annotation you need to save the Display window as a Molecule Document (see the description of Molecule Documents earlier in this chapter). If you want to associate text information with a molecule itself, not its temporary graphical representation, you need to use Comments or User Fields described in Chapter 15.
Styles
A style is a named set of formatting attributes for graphics objects. Styles provide a convenient and powerful way to organize the formatting of graphical maps.
Each style may contain one or more of the following attributes: line, fill, text, and shape.
Vector NTI comes with many standard styles for symbols and labels. You can also define your own. Once created, styles can be saved together with other parameters in the Display Setup Profile or in Vector NTI Setup files.
To learn what style a graphics object has, turn on the Picture Editing mode, select the object and select the Style command from the shortcut menu. The style box in the Picture Element Style dialog will then show the style of the selected object. If more than one object is selected, the style box will show the style of the last object selected. The last selected object also has a focus and is displayed with small squares around it.
Assigning styles to graphics objects
To assign a style to a graphics object, select the object(s) to which you want to assign a style. Then choose the View4 Picture Element4 Style command and go to the style box in the Picture Element Style dialog. You may either choose an existing style from the pull-down list, or type a name, and press the OK button.
If you type the name of an existing style, the style will be assigned to the selected graphics object(s), and the object(s) will take on the format that style describes.
If you type a name which is not in the style list, a new style will be created. The new style will contain the format of the selected object(s). If the selection includes more than one graphics object, a newly-created style will contain only those attributes which are the same for all selected objects.
A style is the base format for a graphics object. You may make additional formatting changes to graphics objects using the methods described in preceding sections.
Changing a styles format
To change the format of a style, select a graphics object. Make sure the object has the style whose format you want to change. Then select the object and give it the format you want the style to take on.
Then choose the View4 Picture Element4 Style command and go to the style box in the Picture Element Style dialog. The name of the current style will be displayed in the Style combo box. Press OK and the Reapply Style dialog box will appear:
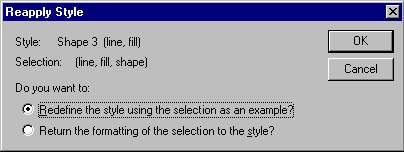
Choose the desired action and press OK.
If you have chosen the Redefine Style option, then any objects that currently have that style will automatically change format to reflect the styles new instructions.
If you have chosen the Return Formatting to Style option, then the selected objects format will be restored to the Styles format.
Saving styles
The set of the styles in the Display Window is a part of the Display Setup settings. It is saved and loaded together with other settings when you add entries to the Display Setup profile or select a previously saved entry.
To save a Display windows current styles, choose the Display Setup command from the Edit menu or press the Display Setup button ( ![]() ) in the Window toolbar and choose the Display Setup command from the popup menu. A Molecule Display Setup dialog will appear. Press the Save Settings As button and enter the name you want to assign to current settings in the Save Settings As dialog box.
) in the Window toolbar and choose the Display Setup command from the popup menu. A Molecule Display Setup dialog will appear. Press the Save Settings As button and enter the name you want to assign to current settings in the Save Settings As dialog box.
Vector NTI 5.0 and later allows you to save styles in the Vector NTI Molecule Setup files. A Setup file contains all the styles and Standard Arrangement parameters of a Display window. Setup files can be used for transferring formatting instructions from one Display window to another. To save current styles to a Setup file, invoke the Display Setup dialog and press the Save To File button in the Graphics Display Settings group. A standard File Save dialog appears, allowing you to choose a file name for current styles and Standard Arrangement information.
Loading styles
You can return to a style saved in a Display Profile by choosing the corresponding profile entry name from the list in the Molecule Display Setup dialog. Vector NTI loads the styles as well as other settings from the profile but does not apply them to the active window right away. You can modify settings if you like and then press the OK button or press the Cancel button to leave the current windows settings unchanged. If you press the OK button, the active Display window will be reformatted according to selected styles.
If you have saved styles in a separate Setup file, you can load it by pressing the Load From File button in the Graphics Display Settings box of the Display Setup dialog. A standard File Open dialog appears, allowing you to choose a Setup file. Press the OK button in the Display Setup dialog to apply new setup to the active Display window.
The sequence pane
In Vector NTI, you usually view and manipulate nucleotide or amino acid sequences in the sequence panes of Display windows. You can define how the sequence should be displayed, and you can have the program show selected features, restriction sites, motifs, and open reading frames. You can select regions of the sequence and view amino acid translations for DNA molecules, copy selected sequence to the Clipboard, etc.
Sequence pane elements
A sequence pane displays a molecules nucleotide or amino acid sequence as well as selected features (for both DNA/RNA and protein molecules) and restriction sites, motifs, and open reading frames (only for DNA molecules). Features are shown with red lines above the sequence (direct strand of DNA/RNA molecules or protein sequence) or below the sequence (complementary strand of DNA/RNA molecules). Features are accompanied by labels showing the name of the feature. REN recognition sites are indicated above the nucleotide sequence with gray lines and labels showing the name of the REN(s). Motifs are indicated above the nucleotide sequence (direct strand motifs) or below the sequence (complementary strand motifs) with black lines and labels showing the name of motif and homology percentage. Open reading frames are indicated by arrows. Arrows above the sequence show direct ORFs; arrows below the sequence show complementary ORFs. Phase indicators in the left margin of the sequence pane show the phase of ORFs.
Changing the settings for nucleotide sequence display
Vector NTI uses common settings to describe what needs to be displayed in all three panes. You can change these settings by choosing the Display Setup command from the Edit menu or press the Display Setup button ( ![]() ) in the Window toolbar and choose the Display Setup command from the popup menu. A Molecule Display Setup dialog will appear. This dialog has two modifications: one for DNA/RNA Display windows, the other for Protein Display windows. The Molecule Display Setup dialog for Protein Display windows contains an option subset available for DNA/RNA Display windows. The Restriction Map, Motifs, and ORFs sections of the dialog are displayed only in the DNA/RNA Display Setup dialog. These sections allow you to choose the elements that will be displayed in the Display window as a whole. The Feature Map and Sequence sections are common for both kinds of dialogs. The Sequence section allows you to set the number of nucleotides per block and the number of blocks per line, as well as choose three or one-letter amino acid codes for translation of nucleotide sequence. The Feature Map section allows you to select the types of features to be displayed in the sequence pane. Since long features take too much space in the sequence pane, you have the option of limiting the length of displayed features.
) in the Window toolbar and choose the Display Setup command from the popup menu. A Molecule Display Setup dialog will appear. This dialog has two modifications: one for DNA/RNA Display windows, the other for Protein Display windows. The Molecule Display Setup dialog for Protein Display windows contains an option subset available for DNA/RNA Display windows. The Restriction Map, Motifs, and ORFs sections of the dialog are displayed only in the DNA/RNA Display Setup dialog. These sections allow you to choose the elements that will be displayed in the Display window as a whole. The Feature Map and Sequence sections are common for both kinds of dialogs. The Sequence section allows you to set the number of nucleotides per block and the number of blocks per line, as well as choose three or one-letter amino acid codes for translation of nucleotide sequence. The Feature Map section allows you to select the types of features to be displayed in the sequence pane. Since long features take too much space in the sequence pane, you have the option of limiting the length of displayed features.
Scrolling the sequence pane
You can scroll the sequence up or down with the sequence panes scroll bars.
Moving around the sequence
The sequence pane has a text cursor which you can move around by pointing and clicking with the mouse or with the arrow keys. If you leave the cursor some place over the sequence for a few seconds, a message will be displayed near the cursor telling you the exact position of the cursor.
Selecting regions of the sequence
The techniques for selecting sequence regions and moving the caret are basically the same for sequence and graphics pane. You can select regions of the sequence by pressing and holding the mouse button and dragging the mouse through the sequence. You can also use the same arrow key as for the graphics pane combinations to select regions of the sequence and move the caret. The general rule is that the shift key should be held down to adjust the existing selection (do not press it if you want to start a new one). The control key should be held down to move the caret in larger increments with arrow keys on the keyboard.
Notice that the selected fragment is also displayed with wireframe in the graphics pane. Vector NTI always displays selection in both panes no matter what pane you used to make it.
Editing the sequence from the sequence pane
Vector NTI allows you to use the same sequence editing operations in the sequence pane as in the graphics pane. Three editing operations make use of the standard Clipboard (Cut, Copy, and Paste); others allow you to insert literal fragments or modify existing fragments.
To Cut, Copy, or Delete a region of the molecules nucleotide or amino acid sequence you need to select it first using the technique described above and then choose the appropriate command from the Edit menu. If the deleted region overlaps with features, Vector NTI will show a confirmation dialog allowing you to keep or remove features. All the features inside the deleted region will be removed without confirmation; positions of other features will be adjusted accordingly.
Vector NTI puts the copied sequence on the Clipboard in the standard text format, so you can freely exchange the sequence data between Vector NTI and other applications. All sequence formats recognized by Vector NTI can be pasted from the Clipboard. The sequence formats are described in detail in Chapter 15 (Import section).
To Paste the sequence from the clipboard you have to cancel the current selection if any and set the caret to the position where you want the new sequence fragment to be inserted. Then, choose the Paste Sequence command from the Edit menu. Vector NTI reads the sequence from the clipboard and displays this sequence in the Insert Sequence dialog box. Press the OK button and the sequence will be inserted at the caret position. If the insertion point lies inside features, Vector NTI will show a confirmation dialog allowing you to keep or remove features. The positions of all features affected by the insertion will be updated automatically.
You can insert a new sequence fragment manually by setting the caret to the desired insertion position and choosing the New4 Insert Sequence command from the Edit menu. Vector NTI displays the Insert Sequence dialog box where you can enter the sequence you want to insert. In the sequence pane you can insert sequence by simply starting to type the characters representing the nucleotide or amino acids. Vector NTI will display the Insert Sequence dialog box with the characters you typed. You can preview and edit your insertion there before the real operation will be performed. Push the OK button to insert the fragment you typed or Cancel to leave molecules sequence unmodified.
Translation
To obtain translations of a region of the nucleotide sequence, select the region you wish to translate. Then press the Translate Direct Strand ( ![]() ) or Translate Complementary Strand (
) or Translate Complementary Strand ( ![]() ) buttons in the Window toolbar, or choose the corresponding commands from the View menu.
) buttons in the Window toolbar, or choose the corresponding commands from the View menu.
Translations of the direct strand appear above the sequence; translations of the complementary strand appear below the sequence. The phase of a translation is shown in the sequence panes left margin.
You can select three- or one-letter protein codes through the Display Setup dialog box.
To turn off protein translations, press the Clear All Translations button ( ![]() ) on the Window toolbar or choose the corresponding command from the View menu.
) on the Window toolbar or choose the corresponding command from the View menu.
Phase indicators for ORFs and protein translations
Phase indicators in the left margin of the sequence pane show the phases of ORFs and protein translations. For translations of the direct strand, the phase is determined by the position of the first selected nucleotide relative to the beginning of the molecule. For the complementary strand, the phase is determined by the position of the last selected nucleotide relative to the end of the molecule.
Finding sequence fragments
Vector NTI allows you to search for sequence in the sequence pane. To display the Find Sequence dialog, activate the graphics pane and press the Find button ( ![]() ) in the Window toolbar, select the Find Sequence command from the Edit menu or press ctrl+f (Windows) or command+f (Macintosh). In the Find Sequence dialog, you can enter the sequence to search for and, in case of DNA/RNA sequences, the strand to search (direct or complimentary). The sequence can contain all standard IUPAC symbols for nucleotide sequence (AGCTURYWSMKBDHVN) and amino acid sequence (ACDEFGHIKLMNPQRSTVWXY). When you press the Find Next button, Vector NTI looks for next match starting from current caret position or the position following the start of the current selection. If the matching sequence is found, Vector NTI selects it and scrolls the sequence pane to make it visible. Otherwise it generates a sound and does not move the caret from its current position. Note, that Vector NTI reaches the last position on a circular DNA molecule, it continues its search from the first position.
) in the Window toolbar, select the Find Sequence command from the Edit menu or press ctrl+f (Windows) or command+f (Macintosh). In the Find Sequence dialog, you can enter the sequence to search for and, in case of DNA/RNA sequences, the strand to search (direct or complimentary). The sequence can contain all standard IUPAC symbols for nucleotide sequence (AGCTURYWSMKBDHVN) and amino acid sequence (ACDEFGHIKLMNPQRSTVWXY). When you press the Find Next button, Vector NTI looks for next match starting from current caret position or the position following the start of the current selection. If the matching sequence is found, Vector NTI selects it and scrolls the sequence pane to make it visible. Otherwise it generates a sound and does not move the caret from its current position. Note, that Vector NTI reaches the last position on a circular DNA molecule, it continues its search from the first position.
Summary
This chapter has given you an overview of Vector NTIs user interface and fully described the use of Display windows, tools for displaying text, graphical, and sequence information for molecules in the Vector NTI database and external files.
The chapter covered the following points:
Creating and setting up Display windows
Use of the folders in text panes
Linking the text pane to graphics and sequence panes
Using the graphics pane
Using the sequence pane
See Also:
Chapter 2 -- Molecule Operations
Chapter 4 -- Tools and Internet Connectivity
Chapter 5 -- Database Explorer
Chapter 15 -- Database Operations
Chapter 17 -- Vector NTI Tools
Chapter 9 -- Advanced Molecule Design
Chapter 13 -- Oligonucleotides and Primers
Chapter 14 -- Molecule Components and Construction
Chapter 10 -- Working With Gel Display windows
Chapter 12 -- Gel Display Windows
Chapter 3 -- Working With Graphics Representation